

Simultaneous Determination of Ofloxacin and Flavoxate Hydrochloride by Absorption Ratio and Second Derivative UV Spectrophotometry
- *Corresponding Author:
- Mahesh Attimarad
Department of Pharmaceutical Sciences, College of Clinical Pharmacy, King Faisal University, Al-Ahsa, KSA
E-mail: mattimarad@gmail.com
Date of Received :05-06-2010
Date of Modified :01-01-2011
Date of Accepted :15-01-2011
Available Online :15-02-2011
Abstract
The objective of this study was to develop simple, precise, accurate and sensitive UV spectrophotometric methods for the simultaneous determination of ofloxacin (OFX) and flavoxate HCl (FLX) in pharmaceutical formulations. The first method is based on absorption ratio method, by formation of Q absorbance equation at 289 nm (λmax of OFX) and 322.4 nm (isoabsorptive point). The linearity range was found to be 1 to 30 μg/ml for FLX and OFX. In the method-II second derivative absorp-tion at 311.4 nm for OFX (zero crossing for FLX) and at 246.2 nm for FLX (zero crossing for OFX) was used for the determination of the drugs and the linearity range was found to be 2 to 30 μg/ml for OFX and 2-75 μg /ml for FLX. The accuracy and precision of the methods were determined and validated statistically. Both the methods showed good reproducibility and recovery with % RSD less than 1.5%. Both the methods were found to be rapid, specific, precise and accurate and can be successfully applied for the routine analysis of OFX and FLX in combined dosage form.
Keywords
Spectrophotometery, second derivative, absorption ratio, ofloxacin, flavoxate HCl, Validation
Introduction
Flavoxate hydrochloride (FLX), 3-methylflavone- 8-carboxylic acid β-piperidinoethyl ester hydrochloride (Figure 1) is strong smooth muscle relaxant, with selective action on the pelvic[1]. It is used for the symptomatic relief of pain, urinary frequency, and incontinence associated with inflammatory disorders of the urinary tract. It is also used for the relief of vesico-urethral spasms resulting from instrumentation or surgery[2]. The literature survey reveals that FLX was analyzed in its pharmaceutical preparations by Ultra-violet spectrophotometry [3,4] high performance liquid chromatography[5-8] and potentiometric determination in combination[10]. The official method for determination of FLX is non-aqueous titration using perchloric acid as titrant in pure form and spectrophotometry in tablets [4]. Gilliland et. al., reported the LC-MS/MS determination of Flavoxate and 3-Methylflavone-8-Carboxylic acid (MFA) in Human NaF Plasma[11].

Figure 1: Structures of Ofloxacin (1) and Flavoxate HCl (2)
Ofloxacin (OFX) a synthetic fluoroquinolone, anti-infective agent has an expanded spectrum of activity and increased antibacterial potency compared with nonfluorinated quinolones [12]. Chemically it is 9-fluro-2, 3 dihydro-3-methyl-10(4-methyl-1- piperazynyl-7-oxo-7H-pyrido [1, 2, 3-de]-1, 4- benzoxacine-6-carboxilic acid (Figure1). It acts by targeting bacterial DNA gyrase and topoisomerase IV. Extensive literature survey reveals that various analytical methods have been reported for the estimation of OFX in single and combination form such as spectrophotometric [13-15], conductometric [16], HPLC [17-22] and LC/MS/MS [23-24].
A solid pharmaceutical formulation containing Flavoxate HCl 200 mg and Ofloxacin 200 mg (film coated tablets) is available in the market for the treatment of urinary tract infections associated with dysuria, nocturia and suprapubic pain. For routine analysis a simple, rapid and cost effective analytical method is preferred. But, till date no single method is yet reported for simultaneous estimation of FLX and OFX. The objective of the present study was to develop simple, rapid, accurate, reproducible, validated and economical analytical methods for the simultaneous determination of OFX and FLX from pure and tablet formulation. Media used was double distilled water.
Experimental
Chemicals and Reagents
Double beam UV-visible spectrophotometer (SHIMADZU 1700), connected to computer and loaded with UV-probe software was used. For all absorbance measurements 1 cm matched quartz cuvettes were used. Shimadzu AUX220 balance was used for weighing the samples. Demineralized and double distilled water and Whatmann filter paper (no.41) were used throughout the experimental work. The sample of ofloxacin was procured from Micro Labs, India and flavoxate HCl from WINDLAS Biotech LTD, India. Multicomponent tablet ZENFLOX UTI (OFX 200 mg and FLX 200mg per tablet) marketed by Mankind Pharma LTD, New Delhi, India was purchased from local market.
Preparation of Standard Stock Solution
Standard stock solutions of OFX and FLX (200 μg/ml) were prepared by dissolving accurately weighed 20 mg of the each drugs in water using 100 ml volumetric flasks separately. The working standard solutions of these drugs were obtained by diluting the stock solutions in water.
Method Devolopment
Method I (Q-Absorbance ratio method):
Q-Absorbance ratio method uses the ratio of absorbances at two selected wavelengths, one at isoabsorptive point and other being the max of one of the two compounds. From the stock solutions, working standard solutions of OFX (20 μg/ml) and FLX (20 μg/ml) were prepared by appropriate dilution and were scanned in the 200-400 nm UV range to determine the maximum absorbance (λmax) and isoabsorptive point. OFX and FLX have λmax at 289 nm and at 317.6 nm, respectively. Both the drugs were found to have same absorbance at 322.4 nm (isoabsorptive point). The wavelengths selected for analysis were 289 nm (λmax of OFX) and 322.4 nm (isoabsorptive point) (Figure2). A series of standard solutions ranging from 1-30 μg/mL of both the drugs OFX and FLX were prepared and the absorbance of solutions was recorded at 289 nm and 322.4 nm to plot a calibration curve of absorbance versus concentration. The calibration curves were found to be linear in the concentration range under study. Absorptivity values of OFX and FLX were determined at selected wavelengths and are presented in Table-1.

Figure 2: UV absorption spectra of OFX(20 μg/ml, O20), FLX(20 μg/ml, F20) and combination (20 μg/ml each, OF20)
| Absorptivity at 289 nm | Absorptivity at 322.4 nm | |||
|---|---|---|---|---|
| Ofloxacin | Flavoxate HCl | Ofloxacin | Flavoxate HCl | |
| *Mean | ax1 = 81.944 | ay1 = 31.285 | ax2= 33.214 | ay2= 33.209 |
| ± RSD | 0.13 | 0.09 | 0.17 | 0.51 |
* Absorptivity values are the mean of six determinations. RSD. is relative standard deviation. ax1 and ax2 absorptivities of Ofloxacin at 289 nm and 322.4 nm, respectively; ay1 and ay2, absorptivities of Flavoxate HCl at 289 nm and 322.4 nm, respectively
Table 1: Absorptivity Values at 289 nm (λmax of OFX) and 322.4 nm (isoabsorptive point)
The concentrations of two drugs in mixture were calculated by using following equations:
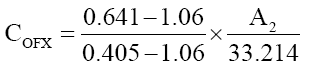 (1)
(1)
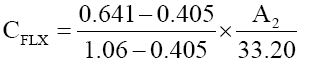 (2)
(2)
where, A2 is the absorbances of mixture at 322.4 nm at different concentrations of ofloxacin and flavoxate.
Method II (Second derivative Spectrophotometric method)
In the second order derivative method, solutions of 20 μg/ml of OFX and FLX were prepared separately. Both the solutions were scanned in the spectrum mode from 200 to 400 nm. The absorption spectra thus obtained were derivatized from first to fourth order. Second order derivative was selected for analysis of both the drugs. The zero crossing wavelengths, 311.4 nm and 246.2 nm were selected for OFX and FLX, respectively. The calibration curves were constructed by scanning different concentration solutions and derivitizing the spectrum. The absorbances of OFX and FLX were measured at a 311.4 nm and 246.2 nm, respectively and working calibration curves of both the drugs were plotted separately. The concentration of individual drug present in the mixture was determined against calibration curve in quantitation mode.
Analysis of Pharmaceutical Dosage Forms
Twenty tablets were weighed; their average weight were determined and finely powdered. The correct amount of powder (equivalent to 20 mg of the drugs) (n=5) was transferred into 100ml volumetric flask and dissolved in 60 ml of water by stirring for 15 min. Than volume was made up to the mark with water. After filtration, an appropriate aliquots were subjected to above methods and the amount of OFX and FLX were determined.
Validation of the Methods
The developed methods were validated according to ICH guideline [25-26] for validation of analytical procedures in order to determine the linearity, selectivity, precision and accuracy for each analyte.
Linearity
Linearity of the proposed methods were determined by analyzing the solutions of OFX in the range of 1-30 μg/ml and FLX in the range of 1 to 75 μg/ml. The Limit of Detection (LOD) and Limit of Quantification (LOQ) was then established by evaluating the minimum level at which the solution of the drug can be readily quantified with accuracy. LOD and LOQ were calculated according to the 3.3σ/s and 10 σ/s criteria, respectively; where σ is the standard deviation of the peak area and s is the slope of the corresponding calibration curve.
Accuracy
Accuracy of the method was determined by performing recovery studies by standard addition method in which pre-analyzed samples were taken (10 μg/ml) and standard drug was added at three different levels i.e. 50%, 100% and 150%. The total concentrations were determined by using the proposed methods. Each level was made in triplicate. The % recovery of the added pure drugs were calculated as % recovery=[(Ct-Cs)/Ca]×100, where Ct is the total drug concentration measured after standard addition; Cs drug concentration in the formulation sample; Ca drug concentration added to formulation.
Precision
Repeatability was assessed by preparing fresh 20 μg/ml solutions from independent stock solutions and measuring the absorbances at selected wavelengths (n=6). Intra-day and inter-day precision of the method were confirmed by repeating the absorbance at 5μg/ml, 10 μg/ml, 15 μg/ml three times in a day and also on two diferent days.
Results And Discussion
Two validated spectrophotometric methods were developed for the simultaneous estimation of OFX and FLX in tablet formulations . Both the drugs are soluble in water and showed good UV absorption, hence to develop simple, economical and nature friendly analytical methods, water has been selected as solvent.
The UV spectra of OFX and FLX 20 μg/ml each and their mixture were reproduced in Figure2. The λmax of OFX and FLX were found to be 289 nm and 317.6 nm, respectively. Three isoabsorptive points were found at 223.2 nm, 311.2 nm and 322.4 nm. In the synthetic mixture mean recovery and standard deviation were found to 100.85±1.92, 101.53±1.66 and 99.24±1.09 at 223.2 nm, 311.2 and 322.4 nm respectively. For constructing Q equation 322.4 nm was selected due to low standard deviation and good mean recovery and another wavelength was 289 nm. In the first method (absorption ratio) linear response obtained was in the concentration range of 1-30 μg/ ml with correlation coefficient 0.9996 for OFX and 1-30 μg/ml with correlation coefficient 0.9998 for FLX (Table 2).
| Method I | Method II | |||
|---|---|---|---|---|
| Beer’s law range | ||||
| Ofloxacin (μg/ml) | 1-30 | 2-30 | ||
| Flavoxate HCl (μg/ml) | 1-30 | 2-75 | ||
| Wavelength (nm) | 289, 322.4 | 311.4, | 246.2 | |
| Correlation Coeffi.(r2) | 0.9996, | 0.9998 | 0.9991, | 0.9997 |
| Slope | 0.081, | 0.062 | 1.46 × 10⁻⁴, | 1.63 × 10⁻⁵ |
| Intercept | 0.0015, 0.011 | 1.65 × 10⁻⁴, | 6.39 × 10⁻⁵ | |
| LOD | 0.32, | 0.25 | 0.60, | 0.31 |
| LOQ | 0.96, | 0.76 | 1.82, | 0.94 |
| %RSD | ||||
| Repeatability | 0.68, | 0.79 | 0.95 | 0.86 |
| Intraday precision | 0.40, | 0.98 | 0.92, | 0.89 |
| Interday precision | 1.26, | 1.06 | 1.35, | 1.18 |
In case of r2, slope, intercept, LOD, LOQ & %RSD value 1st is Ofl oxacin & 2nd is Flavoxate HCl.
Table 2: Validation parameters of both the methods
For second derivative spectroscopy, the spectra of the OFX and FLX obtained by scanning in water, were changed to second derivative spectra (Figure 3). For the second derivative spectra 8 nm was found to be optimum Δλ, hence 8 nm was used. One maxima absorbance and one minima wavelengths were found for OFX at 311.4 nm and 334.7 nm respectively, where zero crossing for FLX (Figure 3 and 4). In the synthetic mixture mean recovery and standard deviation were found to 100.51 ±0.78 and 99.81± 1.68 at 311.4 nm and 334.7 nm respectively. Two minima wavelengths at 246.2 nm, 321.4 nm and three maxima wave lengths at 234.2 nm, 260.4 nm and 352.2 nm were found for FLX where zero crossing for OFX (Figure3 and 5). In the synthetic mixture mean recovery and standard deviation were found to 100.95 ±0.82 99.48 ± 1.89, 101.8± 1.69, 101.26± 1.99 and 101.25± 2.01 at 246.2 nm, 321.4 nm 234.2 nm, 260.4 nm and 352.2 nm respectively. The 311.4nm peak for OFL and 246.2 nm peak for FLX were selected for determination of drug in synthetic mixture and pharmaceutical formulation due to low standard deviation and good mean recovery. Method linear response obtained was in the concentration range of 2-30 μg/ml for OFX and 2 to 75 μg /ml for FLX with correlation coefficient more than 0.999. The LOD and LOQ for method I and method II for both the drugs were calculated (Table 2) and tested practically.

Figure 3: Second order derivative UV absorption spectra of OFX(20 μg/ml, O20), FLX(20 μg/ml, F20)

Figure 4: Second order derivative UV absorption spectra of OFX(2-30 μg/ml)

Figure 5: Second order derivative UV absorption spectra of FLX (2-75 μg/ml)
Accuracy
The excellent mean % recovery values, close to 100% and their low standard deviation (RSD 1.02%) represent high accuracy of the analytical methods. The validity and reliability of the proposed methods were further assessed by determining the mean percentage recovery at 50, 100 and 150 % level. The average % recovery ranges from 99.6% to 100.7% for OFX and FLX for both the methods and are presented in Table-3.
| Sr. No. | Amount of Pure DrugAdded (μg/ml) | % Recovery | ||||
|---|---|---|---|---|---|---|
| Method I | Method II | |||||
| OFX | FLX | |||||
| OFX | FLX | OFX | FLX | |||
| 1 | 5 | 5 | 101.39 | 98.97 | 99.12 | 99.60 |
| 2 | 10 | 10 | 99.54 | 101.31 | 100.58 | 101.16 |
| 3 | 15 | 15 | 101.28 | 99.23 | 99.23 | 100.97 |
| Avg. | 100.736 | 99.653 | 99.643 | 100.576 | ||
| ± RSD | 1.02 | 0.86 | 0.818 | 0.847 | ||
Table 3: Recovery studies
Precision
Precision was determined by studying repeatability and intermediate precision. Repeatability (% RSD) ranged from 0.68% to 0.95% for both the drugs in both the methods (Table 2). Repeatability results indicated the precision under the same operating conditions over a short interval of time and inter assay precision. The inter and intra-day variations (% RSD is less than 1.35%) for both drugs in both the methods. RSD values found for both the drugs in both the methods were well with the acceptable range indicating that these methods have excellent repeatability and intermediate precision.
Estimation of formulation
Solid pharmaceutical formulation (tablets) was analyzed and amount of OFX and FLX determined by proposed methods, the average % amount ranges from 99.604% to 100.884% as shown in Table-4 with standard deviation not more than 1.121%. Assay values of formulation was same as mentioned in the label claim indicating that the interference of excipient matrix is insignificant in estimation of OFX and FLX by proposed analytical methods.
| Sr. No. | Wt. taken(mg each) | % Label Claim | |||
|---|---|---|---|---|---|
| Method I | Method II | ||||
| OFX | OFX | FLX | OFX | FLX | |
| 1 | 20.10 | 99.10 | 101.14 | 99. 13 | 101.15 |
| 2 | 20.00 | 101.9 | 101.32 | 99.16 | 100.70 |
| 3 | 20.10 | 99.26 | 101.50 | 98.81 | 101.6 |
| 4 | 20.10. | 100.54 | 100.52 | 99.61 | 101.91 |
| 5 | 20.10 | 101.2 | 99.26 | 101.31 | 99.06 |
| Avg. | 100.34 | 100.748 | 99.604 | 100.884 | |
| ± RSD | 1.121 | 0.89 | 0.998 | 1.112 | |
Table 4: Results of Assay of tablets by Method I & II
Conclusion
A absorption ratio and second derivative spectrophotometric methods were developed and showed the advantages of being simple, economical, rapid, accurate, precise and nature friendly (water is the media). The sample recoveries from formulation were in good agreement with their respective label claims, which suggested non-interference of formulations excipients in the estimation. Moreover, the present methods are fast with respect to analysis time as compared to sophisticated chromatographic techniques. Hence can be used for the routine analysis of ofloxacin and flavoxate HCl in pharmaceutical formulations and for dissolution samples of formulations.
References
- Pedersen E. Studies on the effect and mode of action of flavoxate in human urinary bladder and sphincter. Urol Int. 1977;32(2-3): 202–08.
- Sweetman SC. Eds, Martindale—The Complete Drug Reference. 33rd ed. London, UK: Pharmaceutical Press; 2002.
- Zheng Y. Ultra-violet spectrophotometric determination of flavoxate hydrochloride tablets. J. Yaowu-Fenxi-Zazhi. 1993;13:339–40.
- British Pharmacopoeia. Vol.I, London: Her Majesty's Stationary Office British Pharmacopoeia Commission; 2005.
- Mahesh Attimarad. Liquid Chromatographic Determination of Flavoxate HCl In Pharmaceutical Formulation. J. Young Pharma. 2010;2(3):115-18.
- Wang Y, Wang TJ, Zhang TL. RP-IP-HPLC Determination of Flavoxate Hydrochloride Tablets. J. Yaowu-Fenxi-Zazhi. 2002;22:202–05.
- Sheu MT, Yeh GC, Ke WT, et al. Development of a high-performance liquid chromatographic method for bioequivalence study of flavoxate tablets. J Chromatogr B Biomed Sci Appl. 2001;751(1):79-86.
- Alaa El-Gindy, Abdel-Salam RA, Shehab Sallam. High-Performance Liquid Chromatographic Determination of Flavoxate Hydrochloride and its Hydrolysis Product. Drug Dev. Ind. Pharma. 2008;34(12):1311 – 22.
- Ghoneim MM, El-Attar MA, Razeq SA. Voltammetric quantitation at the mercury electrode of the anticholinergic drug flavoxate hydrochloride in bulk and in a pharmaceutical formulation. Central Eur. J. Chem. 2007;5(2):496-07.
- Mohamed Heba, Nesrin Ramadana, Moustafa El-Laithy. Polymeric matrix membrane sensors for stability-indicating potentiometric determination of oxybutynin hydrochloride and flavoxate hydrochloride urogenital system drugs. J. AOAC Intl. 2008;91(6):1318-30.
- Gilliland MD, Carnes EJ, Sartwell CJ, et al. LC-MS/MS Determination of Flavoxate and 3-Methylflavone-8-Carboxylic acid (MFA) in Human NaF Plasma, MDS Pharma Services http://www.aapsj.org/ abstracts/Am_2003/AAPS2003-000732.PDF (accessed 28 May 2010) .
- Budavari S, O’Neill MJ, Smith A, et al. Eds., The Merck Index: An Encyclopedia of Chemicals, Drugs and Biologicals,13th Edn., Merck and Co. Inc., Whitehouse Station, NJ, 2001: 6800.
- Mashru RC, Banerjee SK. Spectrophotometric Method for the Determination of Perfloxacin and Ofloxacin Pharmaceutical Formulation. Eastern Pharmacist 1998;41:147-48.
- Zhang XZ, Wen W, Jiang JY, et al. First Order Derivative Spectrophotometry of Ofloxacin Gel. Chinese J. Pharm. 1997;28:314-15.
- Bhusari KP, Chaple DR. Simultaneous Spectrophotometric Estimation of Ofloxacin and Ornidazole in Tablet Dosage Form. Asian J. Res. Chem. 2009;2(1): 60-62
- Tuncel M, Atkosar Z. Determination of Ofloxacin in Tablet by Potentiometry and Conductometry. Pharmazie (Germany). 1992;47:642- 43.
- Argekar AP, Kapadia SP, Raj SV. Determination of Ofloxacin., Norfloxacin and Lomefloxacin, Ofloxacin, Perfloxacin and Ciprofloxacin by RP-HPLC. Indian Drugs. 1996;33:261-66.
- Xu J, Lu W, An YJ. Determination of Ofloxacin by HPLC in Human Serum. Chinese J. Hosp. Pharm. 1993;13:535-36.
- Zhong L, Zhang XZ, Li KL. HPLC Analysis and Stability Study on Ofloxacin Optic Solution. Chinese J. Pharm. 1995;15:213-15.
- Amit JK, Vikram VS, Vikram VW, et al. Simultaneous Estimation of Metronidazole and Ofloxacin in Combined dosage form by RP HPLC Method. Inter. J. ChemTech Res. 2009;1:1244-50.
- Du YX, Luo D, Wang QF. Determination of Antibiotics in Urine and Wipe Samples from Environmental and Biological Monitoring– Reversed Phase HPLC. J. China Pharm. 1994;25:32-35.
- Ohkubo T, Kudo M, Sugawara K. Determination of Ofloxacin in Human Serum by High Performance Liquid Chromatography with Column Switching. J. Chromatogr. 1992;573:289-93.
- Leea HB, Pearta TE, Svobodab ML. Determination of Ofloxacin, Norfloxacin and Ciprofloxacin in Sewage by Selective Solid Phase Extraction, Liquid Chromatography with Fluorescence Detection and Liquid Chromatography– Tandem Mass Spectrometry. J. Chromatogr. A. 2007;1139: 45-52.
- Tuerk J, Reinders M, Dreyer D, et al. Analysis of Antibiotics in Urine and Wipe Samples from Environmental and Biological Monitoring– Comparison of HPLC with UV, single MS and Tandem MS Detection. J. Chromatogr. B. 2006;831:72-80.
- The European Agency for the Evaluation of Medical products. ICH Topic Q2B, Note for Guideline on Validation of Analytical procedures: Methodology, GPMP/ICH/281/95; 1996.
- United States Pharmacopoea, validation of Compendial Methods, 26th edition, Pharmacopoeial Convention Inc., Rockville, MD; 2003: 2439-42.