

Rational Drug Use in a Rural Area of Ethiopia: Based on WHO/ INRUD Prescribing Indicators
2 Department of Pharmacy, College of Medicine and Health Sciences, Arba Minch University, Arba Minch, Ethiopia
Received: 05-Nov-2021 Accepted Date: Nov 19, 2021 ; Published: 26-Nov-2021
Citation: Abiye AA, Kedir HM, Salile SS, et al. Rational Drug Use in a Rural Area of Ethiopia: Based on WHO/INRUD Prescribing Indicators. J Basic Clin Pharma 2021;12(7):104-108.
This open-access article is distributed under the terms of the Creative Commons Attribution Non-Commercial License (CC BY-NC) (http://creativecommons.org/licenses/by-nc/4.0/), which permits reuse, distribution and reproduction of the article, provided that the original work is properly cited and the reuse is restricted to noncommercial purposes. For commercial reuse, contact reprints@jbclinpharm.org
Abstract
Background: Rational use of medicines is a process of appropriate prescribing, dispensing and patient use of medicine for diagnosis, prevention and treatment of diseases and is essential to ensure the quality of health and medical care for patients and the effectiveness of medications used. However, the irrational use of medications in most health care systems in Ethiopia is considered to be a serious dilemma and leads to poor patient outcomes.
Objectives: The current study aimed to evaluate the prescribing pattern using the World Health Organization prescribing indicators at Batu Health Center, Central Ethiopia, located in the East Shewa zone in the Oromia region of Ethiopia.
Materials and methods: A cross-sectional survey was conducted at Batu Health Center from January 1, 2017 to December 30, 2018. The World Health Organization prescribing indicators were used as a standard data collection tool for the evaluation and investigation of prescribing practices. Descriptive statistics were used for analyzing the data.
Results: In this study, we analyzed 700 patient prescriptions and found that the average number of medications per encounter was 1.996, with 99.43% for medications prescribed by generic name. The percentage of encounters with antibiotics and injections prescribed was 86.43% and 13.43%, respectively and 99.78% of medications were prescribed from the Ethiopian Essential Medication List, at Batu health center in Batu, Central Ethiopia.
Conclusion: The current study observed that out of the selected five tools, only the “percentage of patient prescriptions with injections prescribed” (pointer 4) was in line with the standard used.
Keywords
Prescribing indicators, Rational drugs, Prescription, Generic drugs
Introduction
In the health care system, drugs play a crucial role in the prevention and treatment of diseases and their progression in terms of protecting, maintaining, and restoring health. Furthermore, the rational uses of drugs are required to improve the health quality of individuals and their society [1,2].
Rational Drug Use (RDU) demands the prescribing, dispensing, and patient’s use of medicine to be appropriate for diagnosis, prevention and treatment of diseases. It also requires patients to receive medications appropriate to their clinical needs at optimum doses that meet their requirements for an adequate time and at an affordable cost. These are possible by the collaborative efforts of the prescriber and the dispenser [3,4]. Achieving RDU ensures the safety and effectiveness of drugs by minimizing the occurrence of Adverse Drug Reactions (ADRs) and maximizing patient treatment outcomes, hence increasing patient adherence and decreasing patient healthcare-associated costs [5,6].
Irrational Drug Use (IDU) is a serious global concern. It is the primary reason for inappropriate treatment, disease progression, ADR events, a rapid increase in drug resistance, and the additional cost of treatment [3,7]. An estimate of 50% of medication expenditures is wasted through irrational prescribing, dispensing, and improper patient use of medicine, which affects the government budget allocation [8]. Numerous factors are coupled with IDU. Polypharmacy, self-medication practice, and overuse of injection formulations are the major ones [5,9]. According to the World Health Organization (WHO), the RDU for any disease treatment requires a logical approach and common sense through using an appropriate prescribing process which is assumed to be written by a licensed health professional and dispensed to the patient by a licensed pharmacist [9].
Prescribing errors are preventable mainly at the prescriber level by taking appropriate measurements by identifying the gaps that exist in the field [10,11]. The evidence showing the problems associated with prescribing practice is rare in a semi-urban and rural part of Ethiopia and this evidence gap indirectly leads to health-related adverse consequences [12]. Since data from primary health care settings are scarce in Ethiopia, conducting this research has immense relevance to fill the evidence gap.
Moreover, this observational study will be an input for further studies, and its dissemination to different health authorities will create awareness of the general practice scenario and help them to improve the practice in rural healthcare settings. So, this study aimed to evaluate drug use patterns using WHO prescribing indicators in Batu, Central Ethiopia.
Methodology
Description of study setting and period
Batu, earlier recognized as Zeway town, is located in the East Shewa zone, Oromia Region of Ethiopia, 166.7 km South of Addis Ababa, in the middle course of the Ethiopian Rift Valley. The town has a total population of 78,784 (40,180 males and 38,604 females) in 2018, increased from 49,416 in 2000. According to the Batu Town Health Office report, Batu town has two hospitals (i.e., Batu Hospital and Sher Ethiopia Hospital), two government health centers (i.e., Batu 1 and 2 Health Centers), and eight private medium clinics providing services to the Batu inhabitants. Besides, surrounding districts and rural communities receive services from Batu Health facilities making it a critical health service center. As part of the primary healthcare unit system, the primary hospital includes health catchment centers and health posts and serves an estimated 60,000 to 100,000 populations. The general hospital is the next level of care and attends 1-1.5 million people. We conducted the current research at the Outpatient Pharmacy Department (OPD) of Batu 1 Health Center (B1HC), for a period of two months starting from January 1 to March 1, 2019, on Prescriptions (PPs) dispensed, recorded and stored at the B1HC OPD from January 1, 2017 to December 30, 2018 (1-year data as per the WHO recommendation) [13-17].
Study design
The study design was a healthcare facility-based cross-sectional study design used for PPs assessment in the current study to evaluate the prescribing practice based on the WHO prescribing indicators at B1HC, Batu Town, East Shewa Zone, Oromia Region of Ethiopia.
Data collection tool and procedures
We utilized a structured observational checklist that was adopted from the WHO prescribing indicators as a standard data collection tool to evaluate the prescribing practices. Two final-year pharmacy students collected data on prescribing indicators retrospectively from PPs. The primary investigator gave training to the data collectors before commencing the data collection. Data necessary to measure the prescribing indicators were recorded for each patient encounter and entered directly into the prepared form.
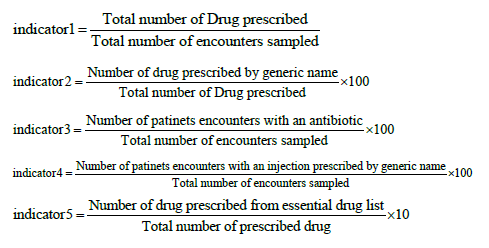
The data abstraction tool had two sections. Demographic characteristics of the patient (extracted from the PP) like age, sex, region, medical diagnosis, prescriber, the total number of prescribed drugs, number of drugs not dispended due to stock out, and a class of medications dispensed were within section one. In the second section, we included the WHO core prescribing indicators. There are five prescribing indicators. These include the average number of drugs per PP, percentage of drugs prescribed by generic name, percentage of prescriptions containing antibiotics, percentage of PPs containing injectable drugs, and percentage of drugs prescribed from the latest edition of national Essential Drug Lists (EDL) or formulary [17].
Indicator 1
Average number of drugs per PP: This indicates the average number of drugs per encounter to measure the degree of polypharmacy. The average calculation is dividing the total number of drug products prescribed by the number of PPs surveyed. It was not relevant whether the patient received the drugs.
Indicator 2
Percentage of drugs prescribed by generic name: Indicates the percentage of drugs prescribed by generic name and was used to measure the tendency to prescribe by generic name. The percentage calculation involves dividing the number of drugs prescribed by generic name by the total number of drugs prescribed, multiplied by 100.
Indicator 3
Percentage of PPs containing antibiotics: Describes the percentage of encounters in which antibiotics were prescribed. It measures the overall level of misused antibiotics. The percentage calculation involves dividing the number of PPs with antibiotics by the overall PPs reviewed, multiplied by 100.
Indicator 4
Percentage of PPs containing injectable drugs: Indicates the percentage of PPs with injections prescribed. It measures the overall level of use of two necessary but commonly overused and costly forms of injectable drugs. The percentage calculation involves dividing the number of PPs during which injections are prescribed by the total number of PPs surveyed, multiplied by 100.
Indicator 5
Percentage of drugs prescribed from the latest edition of EDL: Determines the percentage of drugs prescribed from the essential drug list or formulary. It measures the degree to which prescribing practices conform to the Ethiopia National Essential Medicine List Fifth Edition [18]. The percentage calculation is by dividing the number of drugs prescribed which are listed on the essential medications list or local formulary by the total number of drugs prescribed, multiplied by 100 [17].
Sample size determination and sampling technique
Sampling took place at health facility and patient encounter levels. Drawing a random and representative sample of facilities (i.e., B1HC) was possible using a simple random method (i.e., lottery method) from the available government healthcare facilities (i.e., Batu Hospital, B1HC, and B2HC). According to the WHO document, ‘there should be at least 600 encounters included in a cross-sectional survey to describe the prescribing practices, with a greater number, if possible. If fewer facilities are included, a large number of cases should be selected so that a minimum of 600 encounters is reached. Wherever possible, retrospective data collection over the past year should be used for prescribing indicators [17].
In this study, 700 PPs were collected retrospectively from 2100 PPs using a systematic random sampling method. To draw a systematic sample, we estimated the total number of PPs samples according to WHO, 600 PPs. Thus, dividing the number of PPs represented in the sample frame (N=2100 PPs) by the number of PPs (n=600 PPs) selected gave a sampling interval of 3.5 after collecting the minimum 600 PPs, we collected additional 100 samples using the same way making the sample size 700.
Source and study populations
All prescribed (in the last year, 2017-18) found in the OPD of B1HC were the source populations, while prescriptions selected by the sampling procedure were the study populations.
Eligibility criteria
All PPs prescribed by physicians, nurses and health officers during the study period are included.
Data processing and statistical analysis
The collected data at the B1HC have been entered into a Statistical Package for Social Sciences (SPSS) version 25 software. Descriptive statistics were performed and results are depicted using tables and graphs. In data processing, disease or diagnosis background were excluded from the analysis because more than 50% of PPs were lacking patient diagnosis data.
Results
A sum of 1397 drugs was recorded from the total Prescription Papers (PPs) evaluated (n=700) at B1HC OPD. The number of prescribed drugs was in the range of 1 to 4. Out of the total 700 PPs, 67.7% (474) were with no card number. Besides, 9.9% (69), 10.3% (72), 99.6% (697), and 98.9% (692) PPs had no information about the patients’ age, sex, diagnosis and region respectively (Table 1).
| Indicators number | WHO prescribing indicators | Frequency and percentage N (%) | WHO standard |
|---|---|---|---|
| I | The average number of drugs per encounter | 1397 (1.996) | 1.6-1.8 |
| II | Percentage of drugs prescribed by generic name | 1389 (99.43%) | 100% |
| III | Percentage of encounter with an antibiotic prescribed | 605 (86.43%) | 20.0%-26.8% |
| IV | Percentage of encounter with an injection prescribed | 94 (13.43%) | 13.4%-24.1% |
| V | Percentage of drugs prescribed from the essential drugs list | 1394 (99.78%) | 100% |
Table 1: PPs evaluated based on the WHO prescribing indicators at B1HC, in Batu, Central Ethiopia (n=700).
According to the WHO prescribing indicators, Figure 1 shows the number of injectable drugs prescribed per encounter at B1HC, in which out of the 700 PPs evaluated, about 618 PPs were with no injectable drug. Besides, 77 and 4 PPs had only one injectable drug and two injectable drugs, respectively.

Figure 1: Number of drugs prescribed as injectable per PP to the total number of PPs analysed at B1HC, in Batu, Central Ethiopia (n=700).

Similarly, Figure 2 shows the number of antibiotics prescribed per encounter, in which out of the 700 evaluated PPs, 198 PPs were with no antibiotics, while 415 PPs were with two antibiotics, and 80 and 4 PPs with 3 and 4 antibiotics, respectively.

Figure 2: Total number of antibiotics prescribed per PP to the total number of PPs analysed at BHC, in Batu, Central Ethiopia (n=700).


Discussion
In developing countries like Ethiopia, rural areas receive less attention within the health sector. Because of that, most of the time, these areas are in shortage of many healthcare supplies with few primary healthcare service providers and facilities. Moreover, geographical and other factors limit the commodities’ access. In such a resource-limited setup, rational drug use is a critical issue to consider. Irrational use of drugs on top of the above concerns will immensely aggravate the inadequacy of medical supplies (i.e., drugs), which endangers the patient to poor treatment outcomes.
To advocate RDU, members of the International Network for Rational Use of Drugs (INRUD) and the WHO introduced drug use prescribing indicators. It is one of the most notable achievements in the effort to promote the rational use of drugs. Prescribing indicators provide objective and reproducible measures of the effectiveness and efficiency of drug use and enable the comparison of drug use practices at the facility, regional and inter-country levels. Furthermore, it is a potential tool for supervision and monitoring of drug use practices [17,19].
The first indicator, the “average number of drugs per PPs” acceptable range is between 1.6-1.8, according to WHO. In the current study at B1HC, the calculated value exceeded the limit and was 2 (1.996). Compared to similar studies conducted in India (5.11), Aksum, Ethiopia (2.01), Saudi Arabia (2.4), the current study value was relatively close to the WHO/INRUD standard [20-22]. Polypharmacy practice might be the reason for the observed variations. In contrast, studies conducted in Bahir Dar, North-West of Ethiopia (1.83), were almost close to the WHO standard (Due to a newly applied system reformation in the pharmaceutical and hospital setup of FHRH) than the current study [23].
The second indicator, which is the “percentage of drugs prescribed by the generic name”, is expected to be 100% (WHO/INRUD standard). In the present study, 99.43% of the drugs were prescribed with their generic name, which is less than the expected value [17]. In similar studies conducted in Hawassa, South Ethiopia, Aksum, Ethiopia, Saudi Arabia and India, the percentages (98.7%, 97.6%, 61.2%, and 89.88%, respectively) were relatively low than the current study [24]. This might be due to the limited availability of drugs (as a brand in rural settings like Batu associated with geographical and market factors.
The “percentage of PPs in which antibiotics were prescribed” is the third prescribing indicator. According to the WHO/INRUD, the percentage should be within this range (20%-26.8%). In this study, the percentage was 86.43% (use of highly efficacious antibiotics for mild bacterial infections and the development of resistance, lack of infectious disease specialist might be the reason for the inflation), indicating an enormous difference from the standard. Comparatively, our study scored higher antibiotics utilization percentage than studies conducted in Aksum, Ethiopia (52.3%), Bahir Dar, North-West of Ethiopia (38%), India (24.27%), and Saudi Arabia (32.2%), Addis Ababa, Ethiopia (6.6%) (under use of antibiotics) [25]. Appropriate use of antibiotics is required to avoid the development of resistance.
The fourth prescribing indicator, “percentage of PPs with injections prescribed” should be in this target range (13.4%-24.1%), according to WHO/INRUD standard. In the present study, the percentage was 13.43%, and it is acceptable. In contrast, studies conducted in Addis Ababa, Ethiopia (8.4%), Hawassa, South Ethiopia (38.1%), and Bahir Dar, North-West of Ethiopia (10.8%). Possible reasons for the high use of injections could be the beliefs and attitudes of patients and health professionals about the efficacy of injection versus oral medication.
The last indicator assessed was the “percentage of drugs prescribed from the essential drug list or facility formulary.” The required percentage of it is 100%, according to WHO/INRUD. In the current study, the calculated percent was 99.78%, which is less than the targeted value. In similar studies conducted in Saudi Arabia (99.2%), and India (76.06%), the percentage was not up to the standard. Unlike the current research, 100% scored in Bahir Dar, North-West of Ethiopia study.
Conclusion
The current study assessed prescribing patterns in B1HC, Batu, Central Ethiopia based on WHO/INRUD prescribing indicators and observed that out of the selected five tools, only “percentage of PPs with injections prescribed” (pointer 4) was in line with the standard used. The rest deviated from the standard value/range indicating IDU.
Limitations of the Study
The current study was not without limitations. The conducted survey was in a single-centered study area. Therefore, the use of these samples confines the generalization of the findings of the study. So, conducting further studies is advisable by incorporating other centers. Moreover, only descriptive analysis was done due to poor data recording of important parameters within the health center. Almost all the prescriptions were incomplete and we’re not fit to do further statistical analysis.
Acknowledgement
The authors sincerely thank Addis Ababa University, College of Health Science, for facilitating this study. We also thank the B1HC staff for their cooperation and for making the PPs available.
Author's Contribution
AAA, ABB and BAW conceived the study idea, developed the study design, conducted the study, and analyzed the data. AAA, SSS, HMK and HSA critically revised the manuscript. All Authors approved the final manuscript.
Funding
The authors received no specific funding for this study
Availability of Data and Materials
The datasets used and analyzed in the current study are available from the corresponding author on request.
Ethical Approval
Ethical clearance was obtained from the ethical review board of the School of Pharmacy, College of Health Sciences, Addis Ababa University with Ref No: ERB/SOP/89/01/2018.
Competing Interest
The author declares that there is no competing interest.
REFERENCES
- Mamo DB, Alemu BK. Rational drug-use evaluation based on world health organization core drug-use indicators in a tertiary referral hospital, northeast Ethiopia: A cross-sectional study. Drug, Healthc Patient Saf.2020; 12:15.
- Dessie B, Atalaye G, Diress E, et al. Practice towards rational drug use at Finotselam and Asirade Zewudie Hospitals based on WHO core drug use indicators, Northwest Ethiopia. Sci World J.2020.
- Holloway K, Dijk LV. The World Medicines Situation 2011: Rational Use of Medicines. 2011.
- Holloway KA. Combating inappropriate use of medicines. Expert Rev Clin Pharmacol.2011;4 (3):335-348.
- Sisay M, Mengistu G, Molla B, et al. Evaluation of rational drug use based on World Health Organization core drug use indicators in selected public hospitals of eastern Ethiopia: A cross sectional study. BMC Health Serv Res.2017; 17 (1):1-9.
- Nadew SS, Beyene KG, Beza SW. Adverse drug reaction reporting practice and associated factors among medical doctors in government hospitals in Addis Ababa, Ethiopia. Plos one.2020; 15 (1):e0227712.
- Ofori-Asenso R, Agyeman AA. Irrational use of medicines: A summary of key concepts. Phar.2016; 4 (4):35.
- Lenjisa JL, Fereja TH. A retrospective analysis of prescribing practices through WHO prescribing indicators at four selected hospitals of West Ethiopia. J Bioanal Biomed.2014; 6(4):029-32.
- World Health Organization. Promoting rational use of medicines: core components. WHO.2002.
- Chen YF, Neil KE, Avery AJ, et al. Prescribing errors and other problems reported by community pharmacists. Ther Clin Risk Manag.2005; 1(4):333.
- Agrawal A. Medication errors: Prevention using information technology systems. Br J Clin Pharmacol.2009; 67(6):681-686.
- Velo GP, Minuz P. Medication errors: Prescribing faults and prescription errors. Br J Clin Pharmacol.2009; 67(6):624-628.
- Abiye AA, Fekede B, Jemberie AM, et al. Modern contraceptive use and associated factors among reproductive age group women in three Peri-Urban Communities in Central Ethiopia. J drug deliv ther.2019; 9(6-s):93-102.
- Hassen J, Dinka H. Retrospective analysis of urban malaria cases due to Plasmodium falciparum and Plasmodium vivax: The case of Batu town, Oromia, Ethiopia. Heliyon.2020; 6(3):e03616.
- Tolla HS, Letebo M, Asemere YA, et al. Use of pulse oximetry during initial assessments of children under five with pneumonia: A retrospective cross-sectional study from 14 hospitals in Ethiopia. JoGHR.2019;3.
- Schacher K, Spotts H, Correia C, et al. Individual and household correlates of Helicobacter pylori infection among young Ethiopian children in Ziway, Central Ethiopia. BMC Infect Dis.2020;20(1).
- World Health Organization. How to investigate drug use in health facilities: Selected drug use indicators.WHO.1993.
- EFDA. National Essential Medicine List Fifth Edition.2015.
- Isah AO, Laing R, Quick J, et al. The development of reference values for the WHO health facility core prescribing indicators. Pharmacol Res.2001;18:6-11.
- Pathak A, Gupta VK, Maurya A, et al. Assessment of drug prescribing pattern using WHO indicators in hospitalized patients at a tertiary care teaching hospital in rural area of India. Int J Basic Clin Pharmacol.2016;5(3):651-655.
- Demoz GT, Kasahun GG, Hagazy K, et al. Prescribing pattern of antibiotics using WHO prescribing indicators among inpatients in Ethiopia: A need for antibiotic stewardship program. Infect Drug Resist.2020;13:2783.
- El Mahalli AA. WHO/INRUD drug prescribing indicators at primary health care centres in Eastern province, Saudi Arabia. EMHJ.2012;18(11):1091-1096.
- Laychiluh B. Assessment of drug prescription practice using WHO prescribing indicators in Felege Hiwot Referral Hospital (FHRH) outpatient department, North, Ethiopia. Int J Pharm.2014;4(3):89-94.
- Desalegn AA. Assessment of drug use pattern using WHO prescribing indicators at Hawassa University teaching and referral hospital, south Ethiopia: A cross-sectional study. BMC Health Serv Res.2013;13(1):1-6.
- Berha AB, Seyoum N. Evaluation of drug prescription pattern using world health organization prescribing indicators in tikur anbessa specialized hospital: A cross sectional study. J drug deliv ther.2018;8(1):74-80.