

Quantification of oleanolic acid in the flower of Gentiana olivieri Griseb. by HPLC
- *Corresponding Author:
- Malleshappa N. Noolvi
Department of Natural Chemistry, ASBASJSM College of Pharmacy, Bela (Ropar)-140111, Punjab, India.
E-mail: mnoolvi@yahoo.co.uk
Date of Received: 15-01-2012
Date of Accepted: 20-03-2012
Available Online: 15-05-2012
Abstract
High Performance Liquid Chromatography (HPLC) method is a potent analytical technique for determining phytoconstituents even in minute quantities particularly that are generally present in traces concentrations in medicinal plants. The concentration of oleanolic acid (OA) in the Gentiana olivieri Griseb.(GOG) flowers is quantitatively determined by a simple, precise and accurate HPLC method. HPLC assay was performed on reversed-phase C18 column and compound was detected at 210 nm with a flow rate of 1.0 ml/min. The mobile phase consisted of methanol (A) and 0.03 mol/L phosphate buffer, pH 2.9 (B) with a ratio of 85:15 (A: B v/v).The method showed good precision and accuracy with overall intra-day and inter-day variation of 0.36-1.33% and 0.43-1.15%, respectively, and overall recoveries of 99.32%. Application of these methods to determine the OA in Gentiana olivieri Griseb showed that the concentration of OA was found more in the flower as compared to the whole aerial part (average amount in flower 1.82 mg/g DW and 0.75 mg/g DW in whole aerial plant). A simple and accurate HPLC method has been developed for quantitative determination of OA in GOG flowers.
Keywords
Gentiana olivieri Griseb. (GOG); flower; HPLC; oleanolic acid (OA); Triterpenoids ; Anti-inflammatory.
Introduction
Gentiana olivieri Griseb. (GOG) is a perennial herb found in temperate region of Gulf countries, middle Asia, some temperate region of China, western Himalayas and Pakistan [1]. It is traditionally used in Ayurveda and Unani systems of medicines in arthritis, anti-inflammatory, antidepressant, antiulcerogenic, gastroprotect and sudorific [2-3]. In Turkey the drug is widely used as bitter tonic, appetizer, antipyretic and in some mental disorders [4]. The plant has reported many pharmacological activities as hypoglycaemic, anti-hypertensive [5] and hepatoprotective [6]. Furthermore, several alkaloids, fatty acids, secoiridoids, triterpenoids (oleanolic acid (OA) and ursolic acid from flowers) and bioflavonoids were isolated from the plant [7]. Oleanolic acid is ubiquitous triterpenoid in plant kingdom, medicinal herbs, and is integral part of the human diet. During the last decade over 300 research articles have been published on the research, reflecting tremendous interest has prompted us to develop quantitative HPLC analytical method in the flower of Gentiana olivieri Griseb [8].
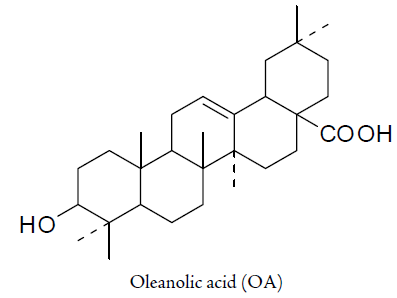
OA is a main triterpenic acid reported in GOG flowers. OA has proved to have pharmacological activities such as anti-inflammatory [9], diuretic , anti-tumor [10], and Anti-HIV [11-12]. It has also been reported as anti microbial [13], anti fungal [14], gestroprotective [15] and hypoglycemic [16] properties. It is relatively nontoxic and has been used in number of health products The present research on this plant involving extraction, identification and pharmacological studies mainly focused on the entire plant with little or no work on flowers of plant which are important source of oleanolic acid. No HPLC method has been reported earlier on the quantification of OA in the flowers of GOG. Henceforth we are reporting in this communication development of simple and accurate HPLC method for determination and quantification of OA in GOG flowers.
Materials and Methods
The HPLC studies on GOG for determination of oleanolic acid was carried in October 2010 at ASBASJSM College of Pharmacy Research Laboratory, Bela, Ropar (India).
Chemicals
OA was purchased from Sigma Chemical Co. (India). Methanol and water used were of HPLC grade. All other chemicals used were of analytical grade.
Preparation of standard solution
A stock solution OA, 1 mg/ml was prepared in methanol. A serial dilution were made on the stock solution with methanol to prepare the concentration of 50, 100, 200, 300 and 400 μg/ml, from each of which 20 μl was used to plot standard curve for OA.
Chromatographic apparatus and conditions
The assay method for quantitative determination of OA in GOG flowers was based on method developed by Chunhua et al., 2007 [17] with modifications. Quantification of OA was performed on an Ultra Performance Liquid Chromatography (UPLC) system (Shimadzu Japan) equipped with LC20A pump, UV detector LC20AD and ODS C18 column (250 × 4.6 mm, 5μm). This compound was detected at 210 nm at 20o C with an eluent flow rate of 1 ml/min. The mobile phase consisted of methanol (A) and 0.03 mol/L phosphate buffer (pH 2.9) (B) with a ratio of 85:15 for detection of OA.
Collection and preparation of plant material
GOG herb was purchased from Himalaya Herbal Store, Saharanpur (UP), India and got authenticated at National Institute of Science Communication and Information Resources , New Delhi (the sample of which is deposited with this institute) wide letter No. NISCAIR/ RHMD/Consult/2009-10/1255/59. The plant was dried, the flower and aerial part separated, grounded into powder. A plant powder aliquot of 0.5g was solubilized in 20 ml ethanol for 2 h followed by 30 min ultrasonic extraction. The samples were extracted twice and both extracts were combined and evaporated to dryness below 40oC. The residue was dissolved in 1 ml methanol filtered through 0.4μm millipore before HPLC analysis.
Validation of the assay
The linearity of the method for each standard was established by injection of 20 μL of standard solutions of different concentrations with five replicates. Calibration graphs were plotted subsequently for linear regression analysis of the peak area with different concentrations i.e. 50, 100, 200, 300, 400 μg/mL at 210 nm absorbance (Figure 1). To determine the intraday precision for each standard, five injections of each concentration were done on the same day. These studies were repeated on three consecutive days to determine the inter-day precision. To determine the extraction recovery, dried flower samples was added with 0.20 mg OA, standard before extraction. The follow-up extractions and HPLC analyses were operated in the same manner as above. The recoveries were calculated as follows:

Figure 1: Standard plot for OA.
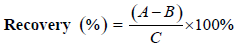
where A is the amount detected, B is the amount of sample without standards and C is the spiked amount of the standards.
Results and Disccussion
Identification of OA by HPLC
OA, standards were all detectable under a wavelength of 210 nm. OA could be eluted efficiently and detected by a mobile phase consisting of methanol (A) and 0.03 mol/L phosphate buffer (pH 2.9) (B) with a ratio of 85:15 (A:B, v/v). With a flow rate of 1.0 mL/min, the mean retention time was 15.43 as shown in Figure 1, Figure 2(a), Figure 2(b) and Figure 2(c)

Figure 2: HPLC chromatogram of OA, (a) standard, (b) the flower extract of Gentiana olivieri Griseb. (GOG) and (c) Aeriel part extract of GOG.
The linearity of calibration curve for OA is validated by the high value of correlation coefficient (i.e 0.9995). The concentrations were determined using calibration standard curves prepared for OA (Figure 1). Figure 2a, 2b, and 2c are the respective HPLC chromatograms of standard, flower and aerial part, the results have shown good accuracy and precision (NMT 4.09%) obtained over the entire selected range of concentrations. The intra- and inter-day variability studied over three consecutive days was NMT 1.33% which is statistically considered to be significant.
Validation of the developed method
Linearity
Linearity studies were carried out to determine whether the established methods could measure different concentrations of OA accurately. OA was determined by measuring the peak area. Five different concentrations, i.e. 50, 100, 200,300 and 400 μg/mL were made for the standard and tested respectively with five repetitions for each concentration. A plot of mean peak area against concentrations of OA gave a linear relationship (with a correlation coefficient, r²=0.9995, n=5) over the concentration range of 50-400 μg/mL. The calibration curves between conc. of OA (xaxis) and peak area (y-axis) at 210 nm were all linear and the regression equation between the mean peak areas (y) against concentration (x) was:
y = 10578x + 30957 (Fig 1)
Reproducibility and accuracy
Reproducibility and accuracy were determined for the standard sample at five different concentrations each as described above (Table 1).The intra-day coefficient of variation on five replica of each concentration was 0.36-1.33% and inter-day coefficient calculated over three consecutive days were 0.43-1.15%. Percentage accuracy for intra and inter-day were -3.96 to 2.8% and -4.09 to 2.71 respectively, showing good accuracy and reproducibility.
| Standard | Nominal concentration (μg/mL) | Assay value (mean ±SD) (μg/mL) | Coefficient of variation (%) | Accuracy (%) |
|---|---|---|---|---|
| Intra-daya | 50 | 48.02 ± 0.64 | 1.33 | -3.96 |
| 100 | 99.29 ± 0.87 | 0.87 | -0.71 | |
| 200 | 205.61 ± 0.74 | 0.36 | 2.8 | |
| 300 | 298.29 ± 3.44 | 1.15 | -0.57 | |
| 400 | 399.25 ± 2.36 | 0.59 | -0.19 | |
| Inter-dayb | 50 | 47.96 ± 0.44 | 0.92 | -4.09 |
| 100 | 99.39 ± 0.82 | 0.82 | -0.61 | |
| 200 | 205.43 ± 0.89 | 0.43 | 2.71 | |
| 300 | 298.27 ± 3.43 | 1.15 | -0.58 | |
| 400 | 399.2 ± 2.37 | 0.59 | -0.2 |
aThe sample was analyzed five times within one day.
bThe sample was analyzed over three consecutive days.
Table 1: Reproducibility and accuracy analysis of Oleanolic acid (n = 5).
Extraction recoveries
To determine extraction recoveries, a measured amount of 0.20 mg OA, was added to the Gentiana olivieri Griseb flower and analyzed as described above (n = 3). The ratio of the assay value to the spiked amount for the standards was calculated. The recovery of OA was 99.32 % data shown in (Table 2).
| Standard | Spiked amount | Assay value (mean ±SD) (μg/ mL) | Recovery rate (%) |
|---|---|---|---|
| Oleanolic acid | 0.20 | 0.199 ± 0.007 | 99.32 ± 3.50 |
Table 2: Recovery tests of the analytic methods for Oleanolic acid (n = 3).
Disccussion
OA is an important constituent with a good food value and a number of pharmacological properties.As per the literature review no work has ever been reported for quantification of OA in GOG by HPLC method. OA was identified and subsequently determined by plotting linear graph with serial standard dilutions and extraction and preparation of plant extract. A good linearity with correlation coefficient r², 0.9995 over the tested range of 50-400μg/mL for OA was obtained. A good analytical method should have a good reproducibility and accuracy. This method showed good reproducibility when tested over three consecutive days with intra and inter-day coefficients of variation of 0.36-1.33% and 0.43-1.15% respectively showing clearly that variations due to time within the assay are neglible. The method showed good precision and accuracy with overall recoveries of 99.32%. Extraction recovery percentages from 80 to 120 [18] are considered to be acceptable by international validation protocols. The recovery of an analyte need not be 100% but in extent of recovering of an analyte and of internal standard should be consistent, precise and reproducible [19]. The results showed that flower contained the higher contents of OA as compared to whole aerial plant (average amount in flower 1.82 mg/g and 0.75 mg/g DW in whole aerial plant). However, each plant part needs to be screened for the presence of OA. The results obtained for the determination of OA in Gentiana olivieri Griseb. supports the earlier work by Chunhua et al.,2007 and Shuge et al., 2010 [17,20] to quantify OA by different methods on different plants with respect to its simplicity, quickness and accuracy. The results are encouraging enough to explore medicinal value of this plant based on this important bioactive constituent.
Conclusion
In this study, simple and accurate HPLC method for the quantification of OA in the flowers of plant Gentiana olivieri Griseb. was developed and validated. The present assay method is the first to be reported for the determination of OA in GOG plant. The whole assay can be completed within about one hour. Another advantage is that minimum sample volume (20μL) is required.
It was concluded that the concentration of OA was found more in the flower (1.82mg) as compared to the whole aerial part (0.75mg). Such detection systems can be used to quantify this bioactive component in Gentiana olivieri Griseb and other related medicinal plants in the future. This method can be a useful tool for quality control of pharmaceutical formulations.
Acknowledgment
The authors would like to thank President Dr. Bhag Singh Bola, Chairman, Captain M.P. Singh and Sardar Sangat Singh Longia, Vice-President, ASBASJSM College of Pharmacy for providing the necessary facilities.
Conflict of Interest
Authors declare no confliict of interest
References
- McGuffin M, Kartesz JT, Leung AY, et al. Herbs of Commerce. 2nd Edn., American Herbal Products Association, America. 2000; p. 421.
- Kirtikar K.R and Basu BD. Indian Medicinal Plants. 3rd edn., Lalit Mohan Basu Allahabad, India, 1998. p. 1877-1879.
- Chopra R.N., Nayar SL and Chopra IC. Glossary of Indian Medicinal Plants. NISCAIR, Delhi; 2006. p. 324-325
- Sezik E, Aslan M, Yesilada E, et al. Hypoglycemic activity of Gentiana olivieri and isolation of the active constituents through bioassay-directed fractionation techniques. Life Sci. 2005; (76): 1223-1238.
- Mansoor A, Zaidi MI, Hyder M, et al. Antihypertensive effct of Gentiana olivieri. J Med Sci. 2004; (4): 176-178.
- Orhan DD, Aslan M, Akty G, et al. Evaluation of hepatoprtective effect of gentiana olivieri herb on subacute administration and isolation of active principles. Life Sci. 2003, (72): 2273-2283.
- Mudassir, AM, Zaidi I and Malghani MAK.Biological efficacy of the extracts and pure compound of Gentiana olivieri. Pak J Biol Sci. 1999; (2): 192-193.
- Liu, J. Oleanolic acid and ursolic acid: Research perspectives. J Ethnopharmacol. 2005; (100): 92-94.
- Vasconcelos M.A, Royo VA, Ferreira DS, et al. In vivo analgesic and anti-inflammatory activities of ursolic acid and oleanolic acid from Miconia albicans (Melastomataceae). Z Naturforsch C. 2006; (61): 477-482.
- Shibata S. Chemistry and cancer preventing activities of ginseng saponins and some related triterpenoid compounds. J. Korean Med. Sci. 2001; (16): 28-37.
- Kashiwada Y, Wang HK, Nagao T, et al. Anti-AIDS agent’s 30.Anti-HIVactivity of oleanolic acid, pomolic acid and structurally related triterpenoids. J Nat Prod. 1998; (61): 1090-94.
- Kashiwada Y, Nagao T, Hashimoto A, et al. Anti-AIDS agents 38.Anti-HIV activity of 3-O-acyl ursolic acid derivatives. J Nat Prod. 2000; (63): 1619-1622.
- Mallavadhani UV, Mahapatra A, Jamil K, et al. Antimicrobial activity of some pentacyclic triterpenes and their synthsised 3-O-lipophilic chains. Biol Pharm Bull 2004; (27):1576-1579.
- Rocha AD, de Oliveira AB, de Souza JD, et al. Antifungal constituents of Cytostoma ramentaceum and Mansoa hirsuta. Phytother Res. 2004; (18) : 463-467.
- Rodriguez JA, Astudillo L and Schmeda-Hirschmann G. Oleanolic acid promotes healing of acetic acid induced chronic gastric lesions in rats. Pharmacol Res. 2003; (48) :291-294
- Perez GR, Perez GC, Perez GS, et al. Effect of triterpenoids of Bouvardia terniflora on blood sugar level in normal and alloxan diabetic mice. Phytomedicine. 1998; (5):475-478.
- Chunhua Z, Kunsong C, Chongde S, et al. Determination of oleanolic acid, ursolic acid and amygdalin in the flower of Eriobotrya japonica Lindl. by HPLC. Biomed Chromatogr. 2007; (21) :705-711.
- De Bievre. The fitness for purpose of analytical methods. A laboratory guide to method validation and related topics. EURACHEM guidance document2004; available at /www.eurachem.org/guides/pdf.
- USFDA. Guidance for Industry: Bioanalytical Method Validation. 2001. FDA, Rockville, MD.
- Shuge T, Yang S, Qian Y, et al. Determination of oleanolic acid and ursolic acid contents in Zizyphus clinopodioides Lam. by HPLC method. Phcog Mag. 2010; (6), 22 :116-119.