Development and validation of reversed phase high-performance liquid chromatography method for estimation of lercanidipine HCl in pure form and from nanosuspension formulation
- *Corresponding Author:
- Dr. Nayanabhirama Udupa
Manipal College of Pharmaceutical Sciences, Manipal University, Manipal - 576 104, Karnataka, India.
E-mail: n.udupa@manipal.edu
This is an open access article distributed under the terms of the Creative Commons Attribution-Non Commercial-Share Alike 3.0 License, which allows others to remix, tweak, and build upon the work non-commercially, as long as the author is credited and the new creations are licensed under the identical terms.
Abstract
Aim: Quantitative estimation of lercanidipine HCl in bulk material as well as from nanosuspension formulations via a developed reverse phase HPLC method. Materials and Methods: Optimized chromatographic condition was used to achieve separation on a Kromasil (100‑5c18 250 × 4.6 mm) column using Shimadzu HPLC system. The mobile phase consisted of a mixture of acetate buffer (20 mM pH 4.5) and acetonitrile in the ratio of 10:90, v/v. It is pumped through the chromatographic system at a flow rate of 1 ml/min. The detection was carried out at 240 nm using ultraviolet‑visible spectrophotometry detector. The method was validated as per Q2 (R1) guidelines, and suitability of the developed method was established by optimized nanosuspension formulation. Results: The method is specific to lercanidipine (RT: 7.7 min), and has ability to resolve the analyte peak from excipient interferences. It is linear (regression coefficient: 0.9993), accurate (average recovery: 100%), and passed all the system suitability requirements. Conclusion: Developed method was found applicable for evaluation of drug content, content uniformity, and analyzing samples of dissolution studies of nanosuspension.
Keywords
Lercanidipine HCl, liquid chromatography, nanosuspension, validation
Introduction
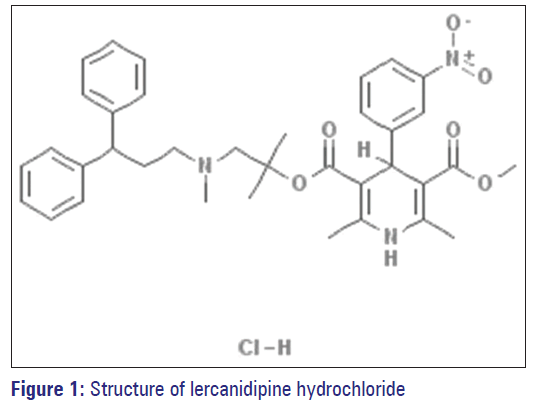
Lercanidipine, 5-O-(1-[3,3-diphenylpropyl(methyl)amino] -2-methylpropan-2-yl) 3-O-methyl 2,6-dimethyl-4- (3-nitrophenyl)-l, 4-dihydropyridine-3,5-dicarboxylate is a dihydropyridine calcium antagonist [Figure 1]. It is used for the management of Stage I and Stage II hypertension and is also perhaps useful in relieving angina pectoris. [1,2]
Lercanidipine HCl is soluble in dimethylformamide, dichloromethane, and methanol. [3] It has a pKa value of about 6.83. [4] It is extremely lipophilic, possess octanol: water partition coefficient (Log P) value of about 6.4. [1]
Preclinical and clinical findings propose that lercanidipine may have protective effects on the kidneys, cardiovascular system, and target organs. Lercanidipine (10 mg/day) produces a smooth antihypertensive effect without unfavorable hemodynamic or sympathetic effects due to its vascular selectivity. Lercanidipine emerged as a flexible choice for antihypertensive treatment across a wide range of patients due to its favorable efficacy and safety profile. Lercanidipine attains maximum plasma concentration within 2–3 h after oral administration and exhibits a slow onset of action. However, it is extensively metabolized by cytochrome P450 3A4. [5] Its low water solubility (5 μg/ml), poor permeability, extensive first pass metabolism, and food dependent absorption result in its low bioavailability of 10%. [2]
There are few HPLC methods described in literature for the analysis of lercanidipine hydrochloride, its impurities and degradation products in bulk as well as in commercial tablets. [6,7] In the present research work, nanosuspensions of lercanidipine hydrochloride were formulated using a wide range of surfactants and polymers as nanosuspension stabilizers and analyzed by proposed method. As lercanidipine is a poorly bioavailable drug, we may expect continuing the research work, in the context of its solubility and permeation enhancement using a broad range of excipients. Therefore, the proposed method has been developed and validated with a definite aim of having a method, which is simple in operation, cost-effective, and able to analyze bulk material, uniformity of dosage, in vitro release samples, and to detect small changes that may occur when drug is processed with various excipients. The method is validated as per ICH Q2 (R1) (validation of analytical procedures: Text and Methodology) guideline. [8] Typical validation characteristics such as accuracy, precision, repeatability, intermediate precision, specificity, limit of detection, limit of quantification (LOQ), linearity, range, and robustness were evaluated.
Materials and Methods
Instrumentation
A Shimadzu HPLC system (LC 2010 HT) equipped with degassing unit, low-pressure gradient unit, pump unit, ultra-fast autosampler, column oven, and an ultraviolet-visible spectrophotometry detector with a thermostatted flow cell was utilized. LC solution software (version 1.24 SP 1, It is the software by SHIMADZU for processing of chromatographic data. Make and model of HPLC system used mentioned under Instrumentation section) was used for data acquisition and system suitability calculations. In addition, Equitron bath sonicator, Millipore Direct Q-3 water purification system, and electronic balances (Denver Instruments, USA and Sartorius, India) were used in the study. Chromatographic parameters used for the determination of lercanidipine HCl are given in Table 1.
| Parameter | Condition |
|---|---|
| Stationary phase | Kromasil 100-5c18 250×4.6 mm |
| Mobile phase | Acetonitrile: 20 mM acetate buffer pH 4.5 (90:10) |
| pH | Adjusted to 4.5 with glacial acetic acid |
| Detection wavelength | 240 nm |
| Run time | 12 min |
| Column oven temperature 25°C | |
| Flow rate | 1 ml/min |
| Injection volume | 20 µl |
Table 1: Chromatographic parameters for determination of lercanidipine HCl
Materials
Lercanidipine HCl hemihydrate obtained as gift sample from Lupin Limited, Research Park, Pune. HPLC grade methanol and acetonitrile were obtained from Finar Chemicals, Gujarat (India). All the surfactants and/or polymers were procured from Loba Chemie Ltd. Mumbai and Sigma-Aldrich Bengaluru, India.
Preparation of nanosuspension of lercanidipine
Lercanidipine (LR) nanosuspensions were prepared by precipitation technique. 50 mg of Lercanidipine was dissolved in sufficient volume (500 μl) of methanol. Several polymers and/or surfactants such as PEG (polyethylene glycol) 400, HPMC (hydroxypropyl methyl cellulose) E15, PVA (poly vinyl alcohol), sodium alginate, methyl cellulose, HPMC E5, and SLS (sodium lauryl sulphate) were used singly or in a combination to act as a stabilizer. The polymers/surfactants were dissolved in water (10 ml) separately. The resulting mixture was kept under high-speed homogenization (Polytron PT 3100) for 15 min at 10000 rpm. The temperature of the stabilizer solution was maintained at 10°C. The drug solution was added all at once in stabilizer solution kept under high-speed homogenization. After complete addition of the drug solution, homogenization was continued for 15 min to get nanosuspension.
Method validation
The developed method was validated for the parameters such as accuracy, precision, repeatability, intermediate precision, specificity, LOD, LOQ, linearity, range, system suitability, and robustness as described below.
Linearity
The linearity of an analytical method is its capability to obtain a test result, which has a certain mathematical relationship to the concentration of analytes. A standard solution of lercanidipine HCl (500 μg/mL) was prepared by dissolving exactly weighed 5 mg of lercanidipine HCl in 10 ml methanol. Different volumes of stock solution were transferred into 10 ml volumetric flasks separately and diluted with mobile phase to yield 5.0–25.0 μg/ml concentration range. Each dilution was prepared in duplicate. Areas for five injections were determined and graph was prepared. Slope and intercept were estimated.
Precision
Method precision (repeatability)
Method precision (repeatability) is the result of the method working over a short time interval under the identical conditions (inter-assay precision). Six replicates of standard solution of lercanidipine HCl (10.0 μg/mL) were analyzed, and chromatograms were recorded. The mean area and % relative standard deviation (RSD) for those injections were calculated.
Intermediate precision
Intermediate precision of the method was checked by repeating the entire procedure on the next day for 3 replicates of standard solution of lercanidipine HCl (10.0 μg/mL). The % RSD for response area and retention time was calculated.
Formulation precision
Prepared nanosuspensions were assessed using the present analytical method. Theoretical drug content of nanosuspension is 5 mg/ml. 1 ml aliquot of nanosuspension was removed from 6 individual batches of nanosuspension and transferred to 10 ml volumetric flasks separately. Volume was made up with methanol and mixed thoroughly using vortex mixer to extract the drug completely. These solutions were filtered through 0.45 μm cellulose membrane filter paper and diluted appropriately to get the concentration of 10 μg/ml. These 6 solutions were injected continuously and calculated the RSD for area and retention time.
Specificity of the method
To determine the specificity of the method in existence of excipients, matrix consisting of several excipients used in final formulation was prepared in 10 ml of mobile phase and solution was filtered through 0.45 μm cellulose membrane filter. Necessary dilutions were made and 20 μl of this solution was injected on column, and peak response was noted.
Accuracy
The developed analytical method was validated for its accuracy in determining the drug content from solution, from the excipient blend, and from formulation. [9]
Recovery from drug solution
The accuracy of the method was performed by recovery study. Accuracy was executed in triplicate for various concentrations of lercanidipine equivalent to 50%, 100%, and 150% of the standard amount. Samples were injected into the HPLC system as per the test procedure. The average % recovery of lercanidipine was calculated. [9]
Recovery from excipient blend (assay by spiking)
Recovery studies from excipients blend was performed by spiking a definite amount of drug solution (50, 100, and 150% of assay concentration) in excipient matrix. The solutions were prepared in methanol in triplicate. The samples were mixed thoroughly using vortex mixer and allowed to dry in a dark place. The dried blend was then reconstituted with mobile phase in 10 ml volumetric flask and this solution was sonicated for 30 min in a bath sonicator. The solutions were filtered through 0.45 μm cellulose membrane filter. Necessary dilutions were made and 20 μl of these solutions were injected. Percentage of drug recovered was calculated using a standard curve prepared. Retention time and peak shape were noted in the presence and absence of excipient blend. [9,10]
Recovery from formulation
Prepared nanosuspensions were evaluated using the present analytical method to determine the drug content. Theoretical drug content of nanosuspension is 5 mg/ml. Different aliquots of 1 ml, 2 ml, and 3 ml were taken from nanosuspensions and transferred to 10 ml volumetric flask separately. Volume was made up with methanol and mixed thoroughly using vortex mixer to extract the drug completely. These solutions were filtered through 0.45 μm cellulose membrane filter paper and diluted appropriately to get the concentrations of 5 μg/ ml, 10 μg/ml, and 15 μg/ml (50, 100, and 150% of assay concentration).
Filter validation
Filter validation was performed by analyzing solutions at 5 and 40 μg/ml (the lowest and highest concentrations of the working solutions). The solutions were analyzed in duplicate after filtration through 0.45 μm cellulose membrane filter. The results were compared with the unfiltered sample injected at the same concentration levels. [10]
System suitability
Data from six injections (at 100% assay concentration) were used for computing system suitability parameters such as tailing factor and number of theoretical plates using software. [9]
Limit of detection and limit of quantification
The LOD and LOQ were calculated on the basis of response and slope of regression equation.
LOD = 3.3 × σ/S and LOD = 10 × σ/S, where σ = the standard deviation of the response, S = the slope of the calibration curve of analyte. [9,11-13]
Robustness
The robustness of an analytical procedure is an extent of its ability to remain unaffected by small, but deliberate changes in method parameters and provides a clue of its reliability during normal usage. The factors chosen for this study were detection wavelength (nm), temperature (°C), flow rate (ml/min), mobile phase (percentage acetonitrile), and pH of the acetate buffer. These factors were changed as per manner shown in Table 2. [9]
| Factors | Variation |
|---|---|
| Detection wavelength (nm) | 240±2 |
| Column temperature (°C) | 25±5 |
| Flow rate (mL/min) | 1±0.1 |
| Mobile phase (percentage acetonitrile) | 90±2 |
| Mobile phase (pH of the acetate buffer) | 4.5±0.2 |
Table 2: Variations in method parameters for robustness studies
Influence of change in the above factors on analysis parameters such as response area, retention time, tailing factor, and theoretical plates were determined by calculating correlation coefficient using “one-factor response surface method” (Stat- Ease Design Expert® Software Version 9).
Results and Discussion
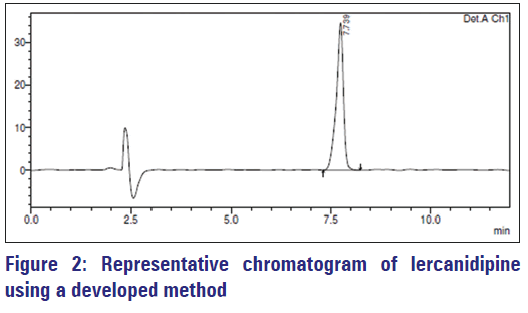
The chromatogram of lercanidipine acquired by developed method is indicated in Figure 2. Lercanidipine elutes at retention time 7.73 min with an average tailing factor of 0.8.
Linearity
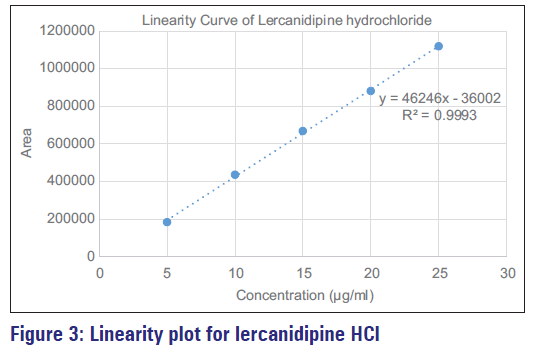
Table 3 indicates the regression statistics obtained for linearity test. The linearity of an analytical method is its capability to produce test results that are directly proportional to the concentration of analyte within a given range [Figure 3]. The method was found linear in the expected concentration range. The regression coefficient was found to be 0.9993, demonstrating its suitability for analysis.
| Concentration (µg/mL) | Area response |
|---|---|
| 5 | 184,552 |
| 10 | 436,234 |
| 15 | 668,450 |
| 20 | 880,805 |
| 25 | 1,118,424 |
| Regression coefficient | 0.9993 |
| Slope | 46246 |
| y-intercept | −36,002 |
Table 3: Regression statistics for lercanidipine HCl
Repeatability
The precision of an analytical method is the extent of agreement between individual test results when the method is applied repetitively to multiple sampling of homologous sample. The method passed the test for repeatability, as percent RSD (0.7%) of the area of the peaks of six replicates injection at 100% assay concentration was within the limits of 2%. % RSD of response area and retention time was calculated and presented in Table 4. [9]
| Parameter | Percentage of RSD for response area | Percentage of RSD for retention time |
|---|---|---|
| Repeatability | 0.704 | 0.467 |
| Intermediate precision | 0.405 | 0.038 |
| Formulation precision | 1.762 | 0.379 |
RSD: Relative standard deviation
Table 4: Results of precision
Intermediate precision
The procedure followed for assay method in method precision was repeated on the next day. As the percent RSD [Table 4] of the response areas obtained was within the limits of 2%; method passed the test for intermediate precision. Therefore, proposed analytical technique has a good intermediate precision. [9]
Specificity of the method
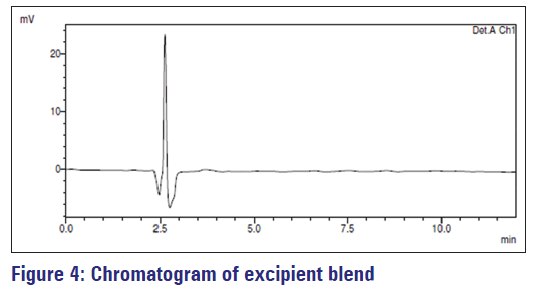
Specificity is the capability of an analytical method to assess unambiguously the analyte in the presence of other components that are present in the sample matrix. The representative chromatogram [Figure 4] of excipient blend indicates that excipients do not interfere with the drug peak [Figure 2], which shows the specificity of the method for lercanidipine.
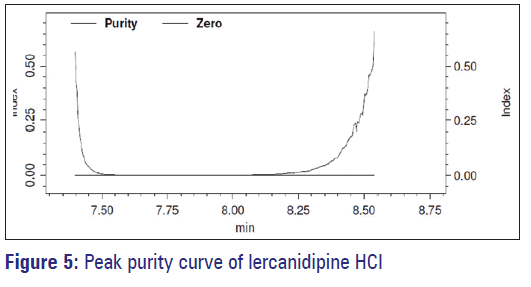
When the developed method was used for the estimation of lercanidipine in dosage form, it was evaluated for the spectral purity in the diode array detector. The purity of the peak constituting for lercanidipine passes the test. The total peak purity index (1.000000) was found to be greater than the single point threshold (0.999714) [Figure 5]. It indicates that the method is highly specific and no other components were co-eluting with the analytes.
Summary of system suitability studies
System suitability test is an essential part of chromatographic methods and performed to confirm that the resolution and reproducibility of the system are suitable for the analysis to be done. The results of system suitability are given in Table 5. All the values for the system suitability parameters are well within the acceptance criteria. [9]
| System suitability parameter | Observation | Acceptance criteria |
|---|---|---|
| Tailing factor | 0.812±0.00 | Should NMT 2.0 |
| Theoretical plates (n) | 8835.71±81.60 | Should NLT 2000 |
Table 5: System suitability parameters
Accuracy
The accuracy of an analytical method determines the closeness of test results obtained by the method to the true value. It can be determined by applying analytical procedure to an analyte of known purity (for a drug substance) or by recovery studies, where known amount of standard is spiked in the placebo (for the drug product).The results of accuracy studies from drug solution, excipient matrix, and formulation are shown in Tables 6 and 7, and it is observed that the method is accurate within desired range. Low % RSD values of drug recovery from formulation at each concentration level indicate uniformity of drug content in dosage form. [9]
| Level of percentage | Added amount | Amount recovered | Percentage of recovery | Percentage of RSD |
|---|---|---|---|---|
| 50 | 5 | 4.9853 | 99.70 | 0.783 |
| 5 | 5.063 | 101.26 | ||
| 5 | 5.074 | 101.48 | ||
| 100 | 10 | 10.2113 | 102.11 | 0.284 |
| 10 | 10.2549 | 102.54 | ||
| 10 | 10.282 | 102.82 | ||
| 150 | 15 | 15.2506 | 101.67 | 0.137 |
| 15 | 15.3033 | 102.02 | ||
| 15 | 15.2891 | 101.92 |
RSD: Relative standard deviation
Table 6: Accuracy/recovery data for lercanidipine HCl from solution
| Parameter | Concentration level | Percentage of recovery | Percentage of RSD |
|---|---|---|---|
| Assay (spiking) | 50 | 96.77 | 1.93 |
| 100 | 99.21 | 1.55 | |
| 150 | 100.58 | 1.50 | |
| Recovery from | 50 | 81.49 | 1.45 |
| formulation | 100 | 82.91 | 1.52 |
| 150 | 83.96 | 1.92 |
RSD: Relative standard deviation
Table 7: Accuracy/recovery data for lercanidipine HCl from excipient matrix and formulation
Limit of detection and limit of quantification
According to the study carried out, the LOD and LOQ of lercanidipine were found 0.219 μg/ml and 0.663 μg/ml, respectively.
Filter validation
The RSD obtained at lower concentration (0.68%) and higher concentration (0.59%) shows suitability of the cellulose membrane filter for the dissolution sample filtration, as the RSD is <2%. [10].
Robustness
Effects of change in factors such as detection wavelength (nm), temperature (°C), flow rate (ml/min), mobile phase (percentage acetonitrile), and pH of the acetate buffer on analysis parameters such as response area, retention time, tailing factor, and theoretical plates were observed in robustness studies and results obtained were indicated in Table 8.
| Mean peak area | Retention time (min) | Tailing factor | |
|---|---|---|---|
| Column temperature | |||
| 20°C | 488,239 | 8.0 | 0.93 |
| 25°C | 438,407 | 7.7 | 0.80 |
| 30°C | 494,136 | 7.3 | 0.86 |
| Detection wavelength | |||
| 238 | 476,452 | 7.7 | 0.8 |
| 240 | 438,407 | 7.7 | 0.80 |
| 242 | 405,298 | 7.7 | 0.8 |
| Buffer pH | |||
| 4.3 | 436,114 | 7.9 | 0.80 |
| 4.5 | 438,407 | 7.7 | 0.80 |
| 4.7 | 438,429 | 7.3 | 0.81 |
| Composition | |||
| 10:88 | 483,465 | 10.2 | 0.75 |
| 10:90 | 438,407 | 7.7 | 0.8 |
| 10:92 | 476,492 | 7.3 | 0.8 |
| Flow rate (ml/min) | |||
| 0.9 | 477,716 | 8.5 | 0.8 |
| 1 | 438,407 | 7.7 | 0.8 |
| 1.1 | 389,578 | 6.9 | 0.81 |
Table 8: Effect of changes in independent factors on chromatographic profile
Effects of changes in independent factors on chromatographic profile were calculated by determining correlation coefficient using “One-Factor Response Surface Method” (Stat-ease Design Expert 9) [Table 9]. All the independent factors are listed in different columns and all the analysis parameters are listed in different rows. Correlation coefficient of particular factor and analysis parameter is indicated by the intersection of respective column and row. The value of correlation coefficient always lies between −1 and +1.
| Column temperature | Detection wavelength | Flow rate | Percentage of acetonitrile | pH of acetate buffer | |
|---|---|---|---|---|---|
| Mean peak area | 0.123 | −0.998 | −0.994 | −0.183 | 0.550 |
| Retention time | −0.995 | 0.525 | −0.998 | −0.885 | −0.941 |
| Tailing factor | −0.659 | 0.000 | 0.953 | 0.828 | 0.290 |
| Theoretical plates | −0.973 | 0.170 | −0.988 | −0.998 | −0.941 |
Table 9: Correction coefficients to show the effect of the different variables studied on chromatographic profile of lercanidipine HCl
Positive value of correlation coefficient indicates a positive association. Negation value of correction coefficient indicates a negative association. The value of correlation coefficient in between ± 0.70 and ± 1 indicates a strong association. Therefore, it can be observed from the above table that change in column temperature has a strong influence on the parameters such as retention time and number of theoretical plates. Change in detection wavelength does not influence tailing factor at all. Flow rate has a strong influence on all the analysis parameters. The value of correlation coefficient in between ± 0.50 and ± 0.70 indicates a moderate association. pH of acetate buffer and peak area have a moderate positive association. The value of correlation coefficient in between ± 0.30 to ± 0.50 indicates a low association. The value of correlation coefficient in between - 0.30 to + 0.30 indicates no association. This indicated that there is a no correlation between column temperature and mean peak area.
Conclusion
A simple and quick analytical method has been developed to be useful in routine to determine lercanidipine in bulk and in its dosage forms. The method proposed by HPLC to determine lercanidipine in nanosuspension has been proved in a linear, precise, accurate, specific way, and robust about the wavelength, flow rate, mobile phase, and temperature.
Financial support and sponsorship
Dr. T. M. A. Pai Endowment Chair, Manipal University, Manipal 576 104.
Conflicts of interest
There are no conflicts of interest.
References
- Available from: http://www.pubchem.ncbi.nlm.nih.gov/compound/ Lercanidipine#section=Top. [Last accessed on 2015 Jun 10].
- Abramowitz W, Kapil R, Riccobene TA, Dedhia M, Rastogi S, Chhettry A. Lercanidipine pH dependant pulsatile release composition US2006/0165788; July 2007.
- More details were not available in Certificate of analysis obtained with lercandipine drug sample.
- Testa R, Leonardi A, Tajana A, Riscassi E, Magliocca R, Sartani A, Lercanidipine: A Novel 1, 4 Dihydropyridine Calcium Antagonist for hypertension. Cardiovascular Drug Reviews 1997;15:187-219.
- Borghi C. Lercanidipine in hypertension. Vasc Health Risk Manag 2005;1:173-82.
- Alvarez-Lueje A, Pujol S, Squella JA, Núñez-Vergara LJ. A selective HPLC method for determination of lercanidipine in tablets. J Pharm Biomed Anal 2003;31:1-9.
- Kaila HO, Ambasana MA, Thakkar RS, Saravaia HT, Shah AK. A Stability-indicating HPLC method for assay of lercanidipine hydrochloride in tablets and for determining content uniformity. Indian J Pharm Sci 2010;72:381-4.
- Validation of analytical procedure; text and methodology Q2(R1), International conference on harmonization of technical requirements for registration of pharmaceuticals for human use. ICH harmonized tripartite guidelines. 2005.
- Épshtein NA. Structure of chemical compounds, methods of analysis and process control validation of HPLC techniques for pharmaceutical analysis. Pharm Chem J 2004;38:40-56
- Tambwekar KR, Kakariya RB, Garg S. A validated high performance liquid chromatographic method for analysis of nicotine in pure form and from formulations. J Pharm Biomed Anal 2003 14;32:441-50.
- Pérez-Lozano P, García-Montoya E, Orriols A, Miñarro M, Ticó JR, Suñé-Negre JM. Development and validation of a new HPLC analytical method for the determination of alprazolam in tablets. J Pharm Biomed Anal 2004;34:979-87.
- Bhagawati ST, Reddy MS, Avadani K, Muddukrishna BS, Dengale SJ, Bhat K. Development and validation of reversed-phase high-performance liquid chromatography method for estimation of rizatriptan benzoate in oral strip formulations. J Basic Clin Pharm 2014;6:7-11.
- Singh R. HPLC method development and validation – An overview. J Pharm Educ Res 2013;4:26-33.


