Comparative analysis of antioxidant and phenolic content of chloroform extract/fraction of Terminalia chebula
- *Corresponding Author:
Date of Received: 12-05-2011
Date of Accepted: 09-06-2011
Available Online: 15-08-2011
Abstract
In the present study, two chloroform extracts of fruits of Terminalia chebula viz. “CHL1” and “CHL 2” prepared by maceration and sequential method respectively was compared for their antioxidant efficacy and phenolic content. The extraction procedure of plant material plays an important role in the activity of phytochemicals. Also, the assessment of antioxidant capacity of phytochemicals cannot be executed precisely by any single method due to complex nature of phytochemicals as multiple reaction characteristics and mechanisms can be involved. So, no single assay could accurately reflect comparison in a mixed or complex system. Therefore in the present study the comparison of extracts was done by using most widely used assays viz. DPPH, deoxyribose, reducing power, chelating power and lipid peroxidation assay. Furthermore, the UV-Vis spectrum of both extracts and the correlation between total phenolic content was examined in order to give an orientation to the search of phytochemicals responsible for their activity. From the results, it was concluded that antioxidant activity and phenolic compounds were predominant in the ‘CHL 2’ prepared by sequential method. The present study enlightening the useful extraction procedure of plant material.
Introduction
Redox regulation is an imperative process for homeostasis in human physiology and presently scientific studies are focused to comprehend its detailed mechanism. Free radical originates in the body by a myriad of biochemical processes that leads to oxidative stress. It is commonly accepted that, in a situation of oxidative stress, more reactive oxygen species (ROS) and reactive nitrogen species (RNS) are generated. Oxidative stress, the shift of the redox balance through oxidative potentials may damage biological molecules altering cell function and leads to various diseases such as neurodegenerative disorders, cancer, cardiovascular diseases, arteriosclerosis, cataracts, and inflammation [1-3]. Antioxidants, molecules that inhibit or prevent oxidation of a substrate, evolved to protect biological systems against damage induced by ROS/RNS [4,5]. A sophisticated, co-operative array of antioxidant defense mechanisms called antioxidant network is found in biological systems. But in stress conditions the defense system of the body fails to provide protection against there harmful radicals, so the antioxidants are provide externally [6]. The health promoting effect of antioxidants from plants is thought to arise from their potential effects on the reactive oxygen/ nitrogen species [7].
Antioxidant properties elicited by plant species have a full range of prospective applications in human healthcare. The history of the use of medicinal plants for alleviation of diseases has its origin in primitive times. It has been recognized that there is an inverse association between consumption of some fruits and vegetables and degenerative diseases, which could be partly attributed to their antioxidant activity [8-10]. Many medicinal plants are explored for their pharmacological activities but, indubitably the plant kingdom still holds several species of plants containing substances of medicinal value that have yet to be discovered. It is reported that phenolic compounds in plants possess strong antioxidant activity and may help to protect cells against the oxidative damage caused by free radicals [11,12]. Due to the presence of the conjugated ring structures and hydroxyl groups, many phenolic compounds have the potential to function as antioxidants by scavenging superoxide anion [13], singlet oxygen [14], and lipid peroxy radicals [15], and stabilizing free radicals.
As part of our efforts to find antioxidants from edible fruits, we have investigated the antioxidant activity of fruits of Terminalia. Chebula, which has been used extensively in the Ayurveda to treat various ailments. It is found in the sub Himalayan tracks from Ravi to West Bengal, Assam and in all deciduous forests of India, specifically in Madhya Pradesh, Bihar, Assam and Maharashtra. The fruits contain about 30% astringent substances like chebulinic acid, tannic acid, gallic acid and chebulagic acid [16-19]. From fruit kernels, palmitic, stearic, oleic, linoleic, arachidic and behenic acids are also isolated. The fruits are mild laxative, stomachic, tonic, alterative, adaptogen, hepatoprotective, febrifuge, antispasmodic, expectorant, anti-asthmatic, antiviral and hypoglycaemic [20-23]. It is also useful in ophthalmia, hemorrhoids, dental caries, bleeding gums, ulcerated oral cavity and in many other diseases. This characteristic makes it a good therapeutic prospect of study.
Materials and Methods
Extraction procedure
The fruits of the T. chebula were purchased locally from market, washed, dried and finally ground to fine powder. The chloroform extract was prepared by maceration and sequential methods.
Maceration method
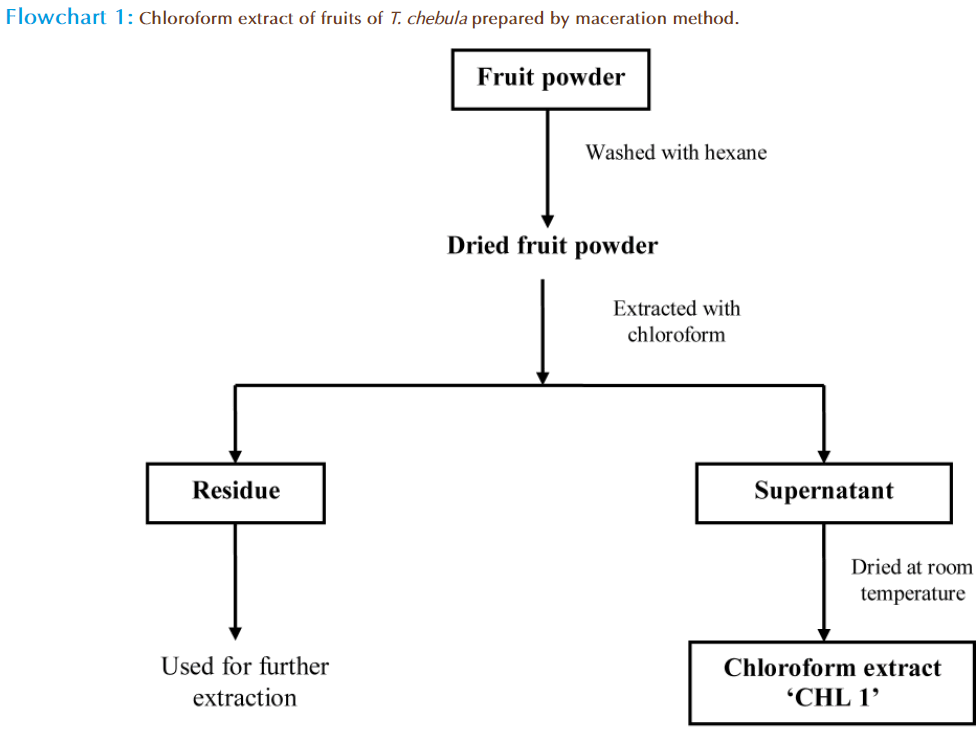
1 kg of dried fruit powder of T. chebula was washed with hexane to remove extraneous matter. After drying of fruit powder the chloroform was added and the mixture was stirred for 24 hours. The suspended solid was filtered through Whatman no.1 filter paper and the filtrate was collected. This procedure was performed thrice to get three filtrates of chloroform and residue. Chloroform filtrate were combined and dried at room temperature in petri plates. The green coloued gummy solid left behind was named as ‘CHL 1’ for all further applications (Flow chart 1).
Sequential method
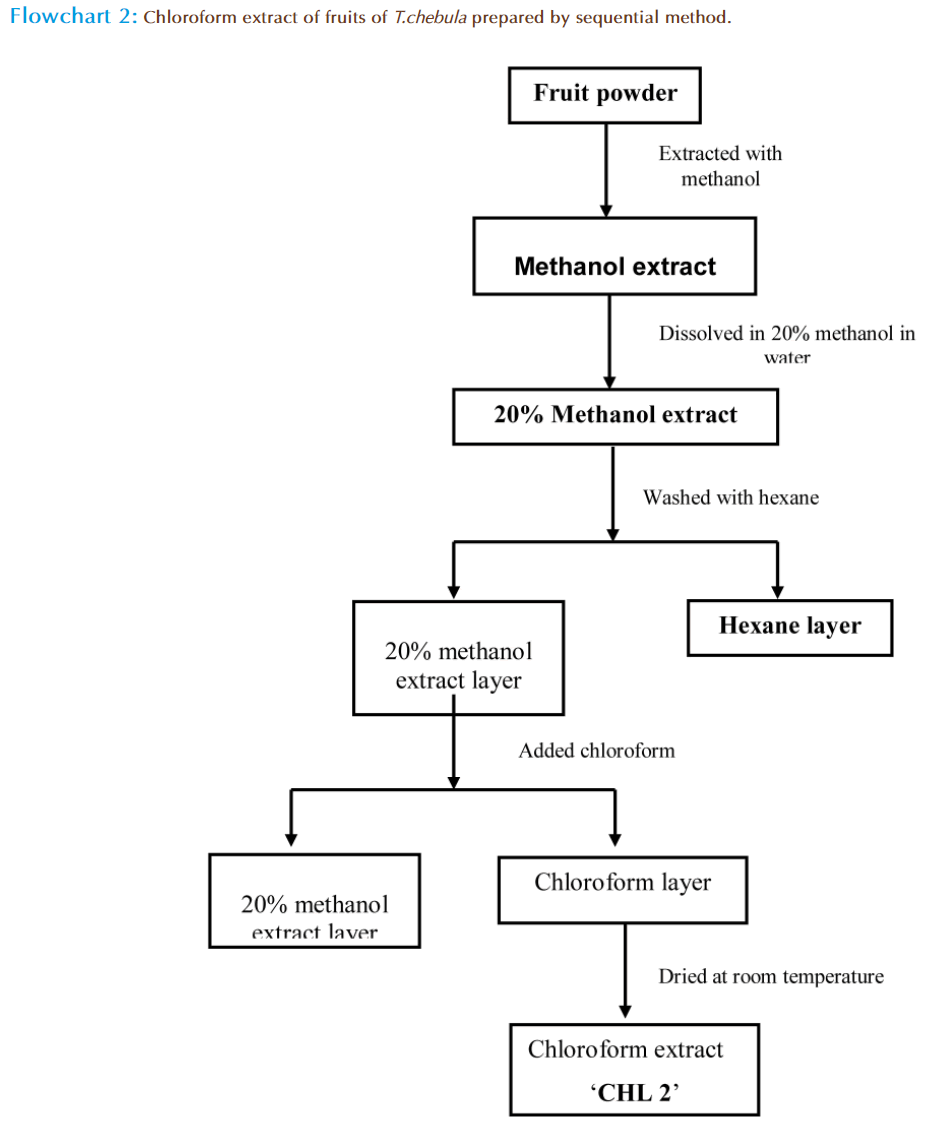
1kg of fruit powder of T. chebula was suspended in methanol and the mixture was kept for 24 hrs at room temperature. The residue was filtered through Whatman no.1 filter paper and filtrate was collected. The filtrate was dried at room temperature by putting in petri plates to get methanol extract. 100g of methanol extract was dissolved in 20% aqueous methanol and put into the separatory funnel. This layer was washed with hexane to remove fatty compounds. Then the chloroform was added in separatory funnel and mixed properly. After some time the two layers were formed which were separated to get chloroform filtrate and 20% aqueous methanol stock. The three filtrates of chloroform were collected and dried at room temperature in petri plates to get chloroform extract named as ‘CHL 2’ (Flow chart 2).
Chemical analysis
Determination of total phenolic content
The total phenolic content of the extract was determined using Folin-Ciocalteu method [24]. To 100μl of extract was added 900μl of water. To this 500μl of FC reagent was added. This was followed by the addition of 1.5ml of 20% Sodium carbonate. The mixture was shaken thoroughly and allowed to stand for 2 hours. The volume of mixture was made up to 10ml with distilled water and absorbance was observed at 765nm. The phenolic content was calculated as gallic acid (mg/g) equivalents.
Spectroscopic analysis of extracts
The ‘CHL 1’ and ‘CHL 2’ extracts of T. chebula were analyzed by UV spectroscopy. For this the solution of ‘CHL 1’ and ‘CHL 2’ was prepared in spectroscopic grade methanol in the concentration of 1mg/10ml, diluted four times and a spectrum was recorded on UV-Visible spectrophotometer (Shimadzu-1601).
Antioxidant testing
DPPH assay
The Hydrogen donor activity of the ‘CHL 1’ and ‘CHL 2’ extracts was measured by 1, 1 diphenyl - 2 - picrylhydrazyl (DPPH) method [25]. The reaction mixture contained 200μl of different extracts concentrations and 2 ml of DPPH. The reaction mixture was observed at 517nm against a blank, which did not contain extract. The % age inhibition was calculated as:
% Inhibition = B0-B1/B0 x100
where, B0 is the absorbance of control, B1 is the absorbance of reaction mixture.
Deoxyribose assay
This was done by non-site specific and site-specific methods with modifications [26]. Stock solution of EDTA (1mM), FeCl3 (10mM), ascorbic acid (1mM), H2O2 (10mM) and deoxyribose (10mM) were prepared in distilled water. In nonsite specific assay, 0.1ml of EDTA, 0.01ml of FeCl3, 0.1 ml of H2O2, 0.36 ml of deoxyribose, 1ml of extracts concentrations (10-100 μg/ml), 0.33 ml of phosphate buffer (50mM, pH 7.4) and 0.1 ml of ascorbic acid were added in sequence. The mixture was incubated at 370C for 1 hour. 1 ml of the incubated mixture was mixed with 1 ml of 10% trichloroacetic acid and 1 ml of thiobarbituric acid (0.025M NaOH) and heated for one hour on water bath at 800C and pink chromogen developed, which was measured at 532 nm. In site-specific assay EDTA was replaced with phosphate buffer. The % age inhibition was calculated as:
% Inhibition = B0-B1/B0 x100
where, B0 is the absorbance of control, B1 is the absorbance of reaction mixture
Reducing power assay
The reducing activity of the ‘CHL 1’ and ‘CHL 2’ extracts was determined according to the method of Oyaizu [27]. 1ml of extract/fractions (50-300μg/ml) was prepared in distilled water and mixed with 2.5 ml of phosphate buffer (0.2M, pH 6.6) and 2.5 ml of 1% potassium ferricyanide. The mixture was incubated at 50oC for 20 min. 2.5 ml of 10% tricholroacetic acid was then added to the mixture and centrifuged at 3000 rpm for 10 min. 1ml of aliquot of supernatant was mixed with 2.5ml of distilled water and 0.5 ml of FeCl3 (0.1%) and absorbance was measured at 700nm. Increase in absorbance was interpreted as increased reducing activity.
Chelating power assay
The chelating activity of extracts was measured as given by Dinis et al. [28] with little modifications. 1 ml of extract with different concentrations was mixed with 3.5ml of methanol, and then the mixture was mixed with ferrous chloride (2mM, 0.1 ml) and ferrozine (1mM, 0.2ml) for 10 min at room temperature. The absorbance was measured at 562 nm against a blank in which the extract was not added. The % age inhibition was calculated as:
% Inhibition = B0-B1/B0 x100
where, B0 is the absorbance of control, B1 is the absorbance of reaction mixture
Lipid peroxidation assay
This method was done according to the method of Halliwell and Guttridge (29). Normal albino rats of the Wistar strain were used for the preparation of liver homogenate. The perfused liver was isolated, and 10% (w/v) homogenate was prepared using a homogenizer at 0-4 °C with 0.15 M KCl. The homogenate was centrifuged at 3000 rpm for 15 min, and clear cell-free supernatant was used for the study of in vitro lipid peroxidation. Different concentrations of extracts mixed with 1ml of 0.15 M KCl and 0.5 ml of rat liver homogenates were added to the test tubes. Peroxidation was initiated by adding 100 μl of 0.2 mM ferric chloride. After incubation at 37 °C for 30 min, the reaction was stopped by adding 2 ml of ice-cold HCl (0.25 N) containing 15% trichloroacetic acid (TCA), 0.38% thiobarbituric acid (TBA) and 0.5% butylated hydroxytoluene (BHT). The reaction mixtures were heated at 80 °C for 60 min. The samples were cooled and centrifuged, and the absorbance of the supernatants was measured at 532 nm. An identical experiment was performed to determine the amount of lipid peroxidation obtained in the presence of inducing agents without any extract. The % age inhibition was calculated as:
% Inhibition = B0-B1/B0 x100
where, B0 is the absorbance of control, B1 is the absorbance of reaction mixture
Statistical Analysis
The data presented as Mean ±SE of three independent experiments
Results and Discussion
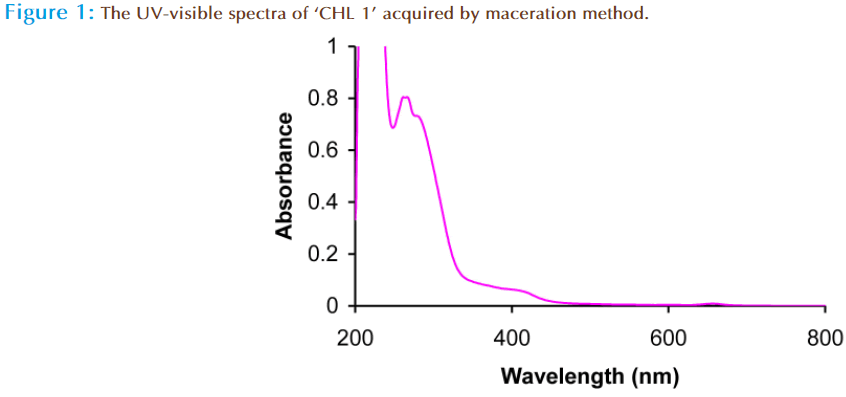
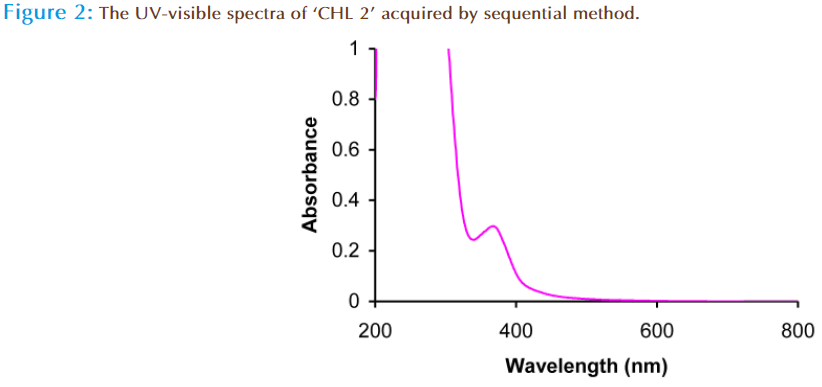
In the present study the comparison of two chloroform extracts was done prepared by different extraction method. From the analysis of total phenolic content, it was observed that the chloroform extract prepared by maceration method has low phenolic content as compared to chloroform extract prepared by sequential method. The phenolic content of ‘CHL 1’ extract was 09mg/g of GAE, while it was 315mg/g of GAE in ‘CHL 2’ extract. To further confirm the presence of phenolic content, the UV analysis of ‘CHL 1’ and ‘CHL 2’ extract was done which again confirmed the presence of phenolic compounds. The UV spectrum of the ‘CHL 1’ extract gives absorbance at λmax in region 260 nm with end absorption around 200nm (Figure 1). The small structureless absorption in region 260nm indicates the absence of polyphenolic and phenolic compounds and indicates the presence of aliphatic/terpenoides in this. The UV spectrum of ‘CHL 2’ extract revealed the absorption around λmax 362nm, which indicated the presence of polyphenolic compounds (Figure 2). Phenolic compounds exhibited two major absorption bands in the ultraviolet/visible region i.e. a first band in the range between 320 and 380 nm and a second band in the 250 to 285 nm range [30]. So, it can be concluded that the ‘CHL 2’ extract contain phenolic compounds as foremost phytochemical.
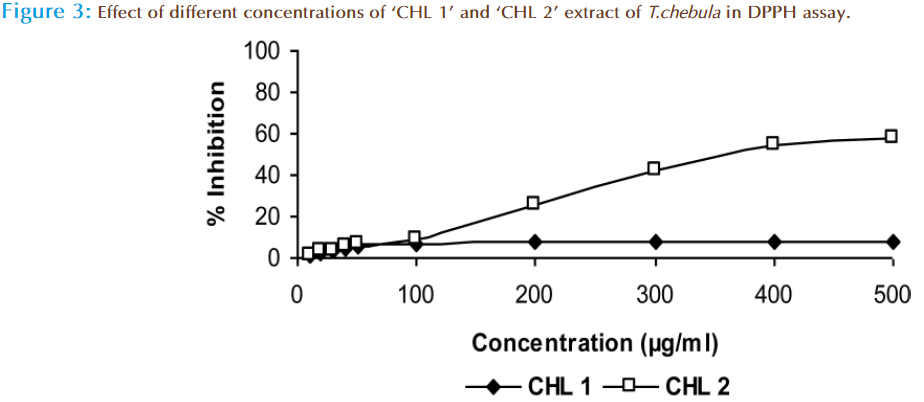
The H-donor ability of ‘CHL1’ and ‘CHL 2’ extracts was measured and compared by using DPPH assay. In this assay, at 500μg/ml dose ‘CHL 1’ extract exhibited 8.1% inhibition and ‘CHL 2’ extract exhibited 58.2 % inhibition (Figure 3). The reaction time of ‘CHL1’ extract was 30-35 minutes and for ‘CHL 2’ extract 15-20 minutes. Possible mechanism of DPPH scavenging was suggested to be through reduction (protonation) of this radical by antioxidant compound to a more stable DPPHH form [31]. Because of its unpaired electron, DPPH has an absorption maximum at 520nm and as it gets reduced as electron paired off in the presence of a radical scavenger. The absorbance decreases stoichiometrically with respect to the number of electrons taken up. So, from the results it can be alleged that ‘CHL 2’ has the hydrogen donating ability which may be due to phenolic content. The labile hydrogen donating capacity of ‘CHL 2’ extract was assessed during this study can be linked to important mechanism of phenolic antioxidant action [32]. The data of the present investigation suggests that the extracts are able to donate electrons and therefore should be able to stabilize the reactive radical to unreactive species. In the absence of the extract, no decrease in DPPH and absorbance was seen with time however, it started decreasing in the presence of extract.
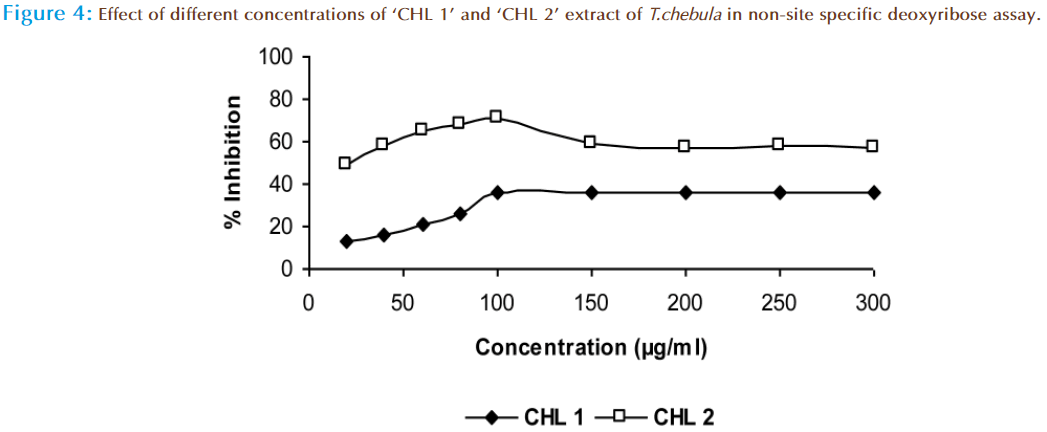
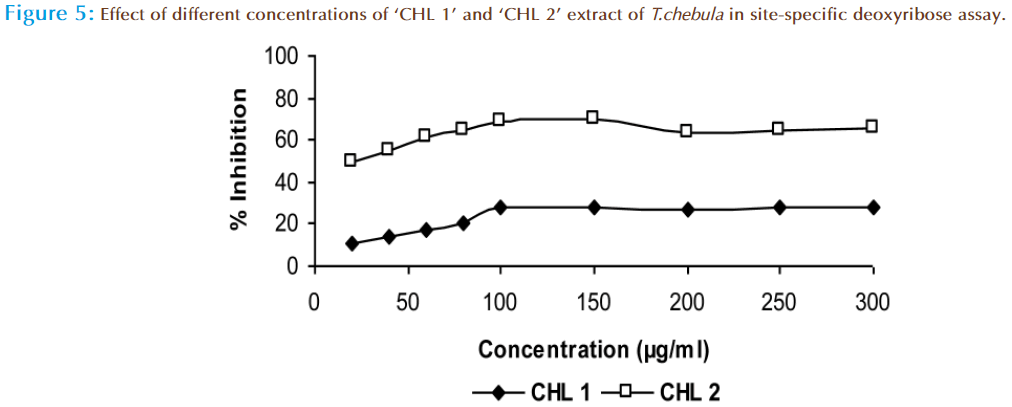
The hydroxyl radical scavenging activity of ‘CHL 1’ and ‘CHL 2’ was compared by using non-site specific and site specific deoxyribose assay. In non-site specific the “CHL 1’ extract showed 36.2% and ‘CHL 2’ extract showed 57.5 2% inhibition at 300μg/ml of dose (Figure 4). In case of site-specific the “CHL 1’ extract showed 27.5% and ‘CHL 2’ extract showed 65.3 % inhibition at same dose (Figure 5). In this method the deoxyribose is degraded by .OH radical formed from Fenton reaction and form malonaldehyde (MDA) fragments, which in turn react with thiobarbituric acid (TBA) to produce a TBA reactive chromophore that was detectable at 532nm [33,34]. Hence, the deoxyribose assay has become a useful experimental tool for investigating the ability to react with .OH radicals. Our results suggested that ‘CHL 2’ extract is not only effective scavengers of .OH in this system but also iron chelator, as it showed more activity in site-specific assay than in non-site specific assay. Thus the compounds, which are able to chelate iron preferentially and change the metal complex in a less redox active form will protect deoxyribose against damage. From the UV-spectroscopy, it is clear that the ‘CHL 2’ extract showed maximum absorbance in polyphenolic region which can be fore most cause of its activity.
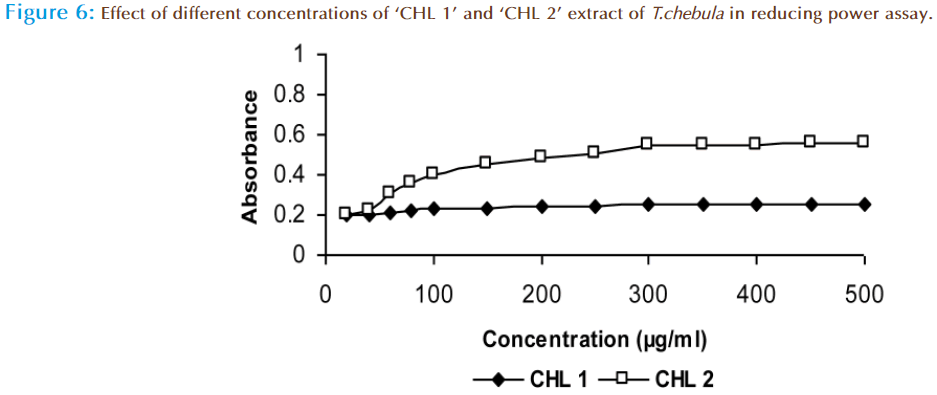
The reducing capacity of a compound may serve as a significant indicator of its potential antioxidant activity [35,36]. Literature reports have shown that the reducing power of bioactive compounds is associated with antioxidant activity [37- 40]. In this assay, the antioxidant capacity is measured on the basis of the ability to reduce ferric (III) ions to ferrous (II) ions in the presence of ‘CHL 1’ and ‘CHL 2’ extracts. The ‘CHL 1’ extract showed 0.255 absorbance and ‘CHL 2’ showed 0.555 absorbance at 500 μg/ml concentration (Figure 6). Less activity of ‘CHL 1’ extract may be due to the absence of phenolic compounds or co-occurrence of other compounds like fatty acids, which hindered its antioxidative activity and made these moieties non-functional. The ‘CHL 2’ extract showed considerable increase in absorption, which may be due to the presence of phenolic compounds as confirmed by UV spectroscopy. Difference in activity of chloroform extracts may be due to variations in extraction procedure which influenced extractability and stability of polyphenolic compounds.
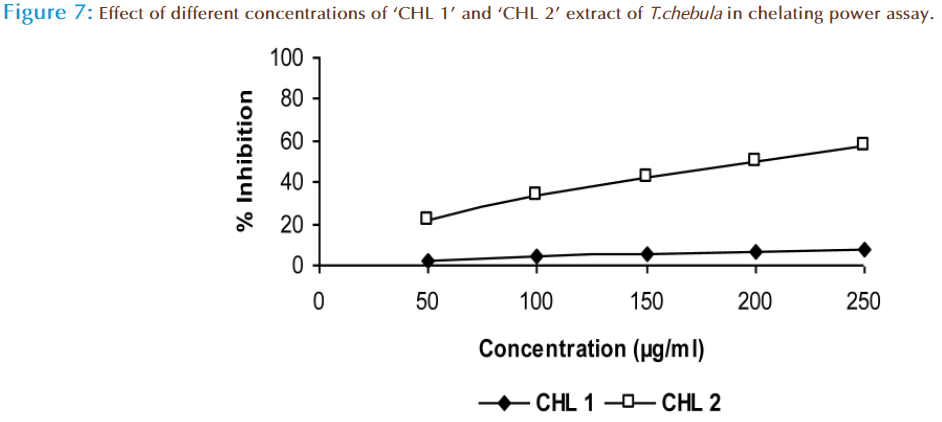
Transition metals contain one or more unpaired electrons that enable them to participate in one-electron transfer reactions so they are powerful catalysts of autoxidation reactions like conversion of H2O2 to .OH in the Fenton reaction and in the decomposition of alkyl peroxides to the highly reactive alkoxyl and hydroxyl radicals [41,42]. The chelating property of the phytochemicals can contribute significantly towards antioxidant behavior. In the present study it was observed that the iron chelating effect of ‘CHL 1’ extract was 7.5 % and ‘CHL 2’ extract was 57.3% at 250 μg/ml of concentration (Figure 7). It was clear that ‘CHL 2’ extract interfered with the formation of ferrous-ferrozine complex, suggesting that it have marked iron chelating activities and capture ferrous ion before the formation of ferrozine.
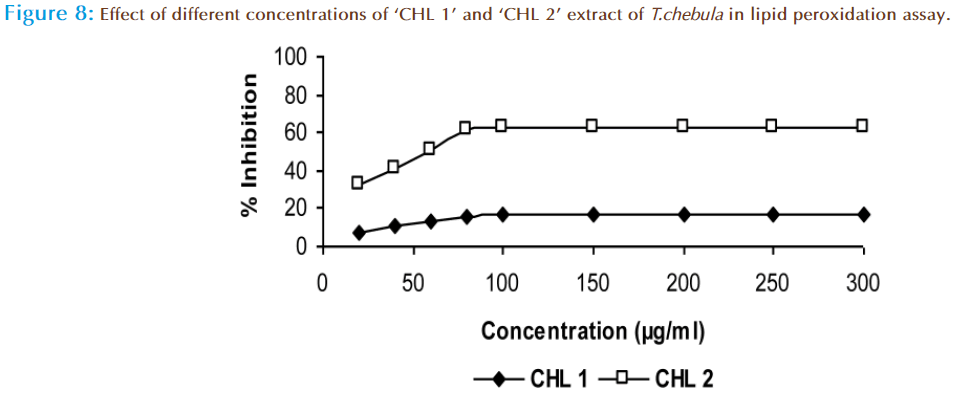
In order to compare the chloroform extracts are capable of reducing in vitro oxidative stress, the lipid peroxidation assay that determines the production of malondialdehyde and related lipid peroxides in living system was carried out. Likewise in earlier experiments, here also the ‘CHL 2’ extract indicated the highest ability of 62.3% and ‘CHL 1’ extract possessed 17.3 % inhibition at highest tested dose (Figure 8). Polyphenols in ‘CHL 2’ extract can combine with hydroxyl radical and convert them into water molecules and stabilize them to inhibit MDA production or they chelate the active iron sites so that the Fenton reaction could not take place. So, it may be supposed that different polyphenols are responsible for antioxidative potential of ‘CHL 2’ extract.
Conclusion
In the end, it can be concluded that ‘CHL 2’ extract of T. chebula prepared by sequential method exhibited good hydrogen donating, radical scavenging, metal chelating, reducing and antioxidant potential. The results obtained from this study showed that extraction method plays an important role in antioxidant potential of any extract. Also, employment of more than one test method specific to a radical species gives a better estimate of comparative antioxidant potential of a test compound.
References
- Halvorsen BL, Holte K, Myhrstad MCW, et al. A systematic screening of total antioxidants in dietary plants. Journal of Nutrition, 2002; 132: 461–471.
- Hegde PS, Rajasekaran NS, Chandra TS. Effect of the antioxidant properties of millet species on oxidative stress and glycemic status in alloxaninduced rats. Nutrition Research, 2005; 25: 1109–1120.
- Papaharalambus CA, Griendling KK. Basic mechanisms of oxidative stress and reactive oxygen species in cardiovascular injury. Trends in Cardiovascular Medicine, 2007; 17: 48–54.
- Shahidi F, Wanasundara PK. Phenolic antioxidants. Critical Reviews of Food Science & Nutrition, 1992; 32: 67–103.
- Halliwell B. Antioxidant characterization. Methodology and mechanism. Bio-chemical Pharmacology, 1995; 49: 1341-1348.
- Blomhoff R, Carlsen MH, Andersen LF, et al. Health benefits of nuts: Potential role of antioxidants. British Journal of Nutrition, 2006; 96: 52–60.
- Silva BA, Ferreres F, Malva JO, et al. Phytochemical and antioxidant charac-terization of Hypericum perforatum alcoholic extracts. Food Chemistry, 2005; 90: 157–167.
- Eberhardt MV, Lee CY, Liu RH. Antioxidant activity of fresh apples. Nature, 2000; 405: 903–904.
- Gey KF. The antioxidant hypothesis of cardiovascular disease: Epidemiology and mechanisms. Biochemical Society Transactions, 1990; 18: 1041–1045.
- La Vecchia C, Altieri A, Tavani A. Vegetables, fruits, antioxidants and cancer: A review of Italian studies. European Journal of Nutrition, 2001; 40: 261–267.
- Kahkonen MP, Hopia AI, Vuorela HJ, et al. Antioxidant activity of plant extracts containing phenolic compounds. Journal of Agricultural & Food Chemistry, 1999; 47: 3954–3962.
- Kaur P, Singh B, Kumar S, et al. In vitro evaluation of free radical scaveng-ing activity of Rubia cordifolia L. Journal of Chinese Clinical Medicine, 2008; 3: 278-284.
- Robak J, Dryglewski RJ. Flavonoids are scavengers of superoxide anion. Biochemical Pharmacology, 1988; 37: 83–88.
- Husain SR, Cillard J, Cillard P. Hydroxyl radical scavenging activity of favo-noids. Phytochemistry, 1987; 26: 2489–2491.
- Torel J, Cillard J, Cillard P. Antioxidant activity of flavonoids and reactivity with peroxy radical. Phytochemistry, 1986; 25: 383–385.
- Saleem A. Biological activity of plant phenolics with an emphasis on Paki-stani plants used in traditional health care. 2002, Ph.D. Thesis, University of Turku. ISBN 951-29-2188-9, Painosalama Oy. Turku, Finland.
- Khare CP. Encyclopedia of Indian Medicinal Plants. Berlin: Springer-Verlag; 2004: 451–453
- Harborne JB, Baxter H, Moss GP. Phytochemical Dictionary. A Handbook of Bioactive Compounds from Plants, London: Taylor & Francis; 1999: 570
- Rastogi RP, Mehrotra BN. Compendium of Indian medicinal plants. 1994: 838-841.
- Kirtikar KR, Basu BD. In Indian medicinal plants. In Blatter E, Caius JF, Mhaskar KS, eds Allahabad: 1983
- Rege NN, Thatte UN, Dahanuka SA. Adaptogenic properties of six rasayana herbs used in Ayurvedic medicine. Phytotherapy Research, 1999; 13: 275- 291.
- Singh C. 2-α-hydroxy micrometric acid, a pentacyclic triterpene from Termi-nalia chebula. Phytochemistry, 1990; 29: 2348-50.
- Barthakur NN, Arnold NP. Nutritive value of the chebulic myroblan (Termi-nalia chebula Retz.) and its potential as a food source. Food Chemistry, 1991; 213-19.
- Yu L, Haley S, Perret J, et al. Free radical scavenging properties of wheat extracts. Journal of Agricultural and Food Chemistry, 2002; 50: 1619–1624.
- Blois MS. Antioxidant determinations by the use of a stable free radical. Nature, 1958; 26: 1199-1200.
- Halliwell B, Gutteridge JMC, Aruoma OI. The deoxyribose method: a simple test-tube assay for determination of rate constants for reactions of hydroxyl radicals. Analytical Biochemistry, 1987; 165: 215–219.
- Oyaizu M. Studies on product of browning reaction prepared from glucose amine. Japanese Journal of Nutrition, 1986; 44: 307-315.
- Dinis TCP, Madeira VMC, Almeida LM. Action of phenolic derivates (ac-etoaminophen, salicylate, and 5-aminosalicylate) as inhibitors of membrane lipid peroxidation and as peroxyl radical scavengers. Archives of Biochemistry and Biophysics, 1994; 315: 161– 169.
- Halliwell B, Guttridge JMC. In Free Radicals in Biology and Medicine. Japan: Japan Scientific Societies Press; 1989
- Matthaus B. Antioxidant activity of extracts obtained from residues of different oilseeds. Journal of Agricultural and Food Chemistry, 2002; 50: 3444-52.
- Gadow A, Joubert E, Hansmann CF. Comparison of the antioxidant activ-ity of aspalathin with that of other plant phenols of rooibos tea (Aspalathus linearis), a-tocopherol, BHT, and BHA. Journal of Agricultural and Food Chemistry, 1997; 45: 632–638.
- Yildirim A, Mavi A, Oktay M. Comparison of antioxidant and antimicrobial activities of tilia (Tilia argentea Desf. Ex. D.C.) sage (Salvia triloba L.) and black tea (Camellia sinensis L.) extracts. Journal of Agricultural and Food Chemistry, 2000; 48: 5030-5034.
- Ohkawa H, Ohishi N, Yagi K. Assay for lipid peroxides in animal tissues by thiobarbituric acid reaction. Analytical Biochemistry, 1979; 95: 351-358.
- Soares JR, Dinis TCP, Cunha AP, et al. Antioxidant activities of some ex-tracts of Thymus zygis. Free Radical Research, 1997; 26: 469-478.
- Awika JM, Rooney LW, Wu X, et al. Screening methods to measure antioxi-dant activity of sorghum (Sorghum bicolor) and sorghum products. Journal of Agricultural and Food Chemistry, 2003; 51: 6657-6662.
- Jeong SM, Kim SY, Kim DR, et al. Effects of heat treatment on the antioxi-dant activity of extracts from citrus peals. Journal of Agricultural and Food Chemistry, 2004; 52: 3389-3393.
- Duh PD. Antioxidant activity of burdock (Arctium lappa Linne): Its scav-enging effect on free-radical and active oxygen. Journal of American Oil Chemist Society, 1998; 75: 455-461.
- Yildirim A, Mavi A, Kara AA. Determination of antioxidant and antimicro-bial activities of Rumex crispus L. extracts. Journal of Agricultural and Food Chemistry, 2001; 49: 4083-4089.
- Siddhuraju P, Mohan PS, Becker K. Studies on the antioxidant activity of Indian Laburnum (Cassia fistula L.): a preliminary assessment of crude ex-tracts from stem bark, leaves, flowers and fruit pulp. Food Chemistry, 2002; 79: 61-67.
- Dorman HJ, Kosar M, Kahlos K, et al. Antioxidant properties and composi-tion of aqueous extracts from Mentha species, hybrids, varieties and cultivars. Journal of Agricultural and Food Chemistry, 2003; 51: 4563- 4569.
- Lloyd RV, Hanna PM, Mason RP. The origin of the hydroxyl radical oxygen in the Fenton reaction. Free Radical Biology and Medicine, 1997; 22: 885-88.
- Hippeli S, Elstner EF. Transition metal ion-catalyzed oxygen activation dur-ing pathogenic processes. FEBS Letters, 1999; 443: 1-7.


