A conventional HPLC-MS method for the simultaneous determination of ofloxacin and cefixime in plasma: Development and validation
- *Corresponding Author:
- Dr. Mahesh V. Attimarad
Department of Pharmaceutical Science, College of Clinical Pharmacy, King Faisal University, P. O. Box 400, Al-Ahsa 31982, Saudi Arabia.
E-mail: mattimarad@gmail.com
Abstract
Objective: A simple, rapid, and sensitive high performance liquid chromatography-mass spectrometry (HPLCMS) method was developed and validated for the simultaneous determination of oô€loxacin (OFL) and ceô€ixime (CEF) in human plasma using the moxiô€loxacin as internal standard. Methodology: Analytes were separated using an Agilent LCMS system equipped with a Zorbax eclipse XBD C18 column (150 mm × 4.6 mm i.d., 5 μm) and using a mobile phase consisting of a mixture of acetonitrile, methanol and 0.5% formic acid in a ratio of 23:10:67% v/v and ô€low rate was set at 0.6 mL/min. Plasma samples were extracted using the protein precipitation with acetonitrile and analyzed by positive ion mode. Results: The linearity of the proposed method was investigated in the concentration range of 4-500 ng/mL (r = 0.9996) for OFL and 40-6000 ng/mL (r = 0.9998) for CEF. The lower limits of quantiô€ication were 4 ng/mL and 40 ng/mL for OFL and CEF respectively, which reach the level of both drugs possibly found in human plasma. Further, the reported method was validated as per the ICH guidelines and found to be well within the acceptable range. Conclusion: The proposed method is simple, rapid, accurate, precise, and appropriate for pharmacokinetic and therapeutic drug monitoring in the clinical laboratories.
Keywords
Cefixime, HPLC-MS, ofloxacin, plasma, validation
Introduction
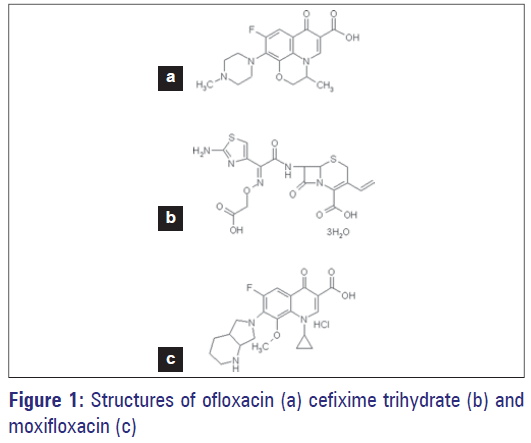
Ofloxacin (OFL) ((±)-9-fluro-2, 3 dihydro-3-methyl-10 [4-methyl-1-piperazynyl-7-oxo-7H-pyrido [1, 2, 3-de]-1, 4-benzoxacine-6-carboxilic acid [Figure 1a]) is one of the most frequently used fluorinated quinolone antibiotics. [1] It is potent 3rd generation fluorinated quinolone antibiotic and mechanism of action is belived to at bacterial Deoxyribonucleic acid gyrase and topoisomerase IV. [2]
Cefixime (CEF) ([6R, 7R]-7-[[2-[2-amino-1,3-thiazol-4-yl]-2 [carboxymethyloxyimino] acetyl]amino]-3-ethenyl-8-oxo-5- thia-1-azabicyclo[4.2.0]oct-2-ene-2-carboxylic acid [Figure 1b]). It is effective against bacteria causing infection of the ear, throat, urinary tract, gonorrhea, and pneumonia. [3,4] CEF is also used for the treatment of multidrug-resistant enteric fever and pharyngitis in children. It is the best oral antibiotic for switch therapy due to its very good efficacy and safety profile an d an inexpensive nature.
A combination of OFL and CEF is available in the market, which is highly active against typhoid fever, urinary and respiratory tract infections, noscomial infections, soft-tissue, and intra-abdominal infections caused by bacteria. [5-7] Two analytical methods namely HPLC [8] and HPTLC [9] are reported for the simultaneous determination of OFL and CEF in pharmaceutical preparations, but for the simultaneous estimation of OFL and CEF in human plasma has not been reported so far. On the other hand, reported methods for the determination of OFL and CEF were in single or with other drugs in pharmaceutical preparations and biological fluids. Some of the other reported methods were spectrophotometry, [10] fluorometry, [11-13] HPLC, [14-23] liquid chromatography tandem mass (LC-MS/MS) [24,25] and capillary electrophoresis. [26-30] Further, most of the reported methods for the determination of OFL and CEF in biological fluids involve tedious sample preparation procedures (liquid/ liquid or solid phase extraction), low extraction yields and low sensitivity. Recently, a determination method using the LCtandem mass spectrometry (LC-MS/MS) has been reported for the estimation of CEF. [24] However, the MS-MS detector needs to be delicately set and LC-MS/MS equipment is very expensive. HPLC method with Ultraviolet detection has been reported for the determination of CEF in serum samples with the different sensitivities (200 ng/mL [15] and 50 ng/mL [4]). However, the analytical run time was found to be much high (>10 min). Furthermore, a very low concentration of OFL determination was achieved using HPLC fluorescent detector. [17] However, fluorescent detector can’t be used in our method because CEF is not fluorescent. To bypass these difficulties, we have developed more conventional procedures for determining OFL and CEF using the LC coupled with the mass spectrometry (LC-MS). This assay is simple and robust, as well as sufficiently sensitive for pharmacokinetic studies. Hence, in the present study, simple analytical method was developed and validated for simultaneous determination OFL and CEF in human plasma. Newly develop method could be used for pharmacokinetic and therapeutic drug monitoring.
Experimental
Chemicals and reagents
In this study, analytical grade chemicals and reagents were used. OFL, CEF, and the internal standard moxifloxacin (MOX), [Figure 1c] were received as gift samples. Acetonitrile, methanol, formic acid, acetic acid, and ammonium acetate were purchased from Sigma (St Louis, MO, USA).
Stock solutions (10 μg/mL) of OFL, CEF, and MOX were prepared in the methanol. These solutions were diluted with mobile phase for further use. The drug-free human plasma was spiked with the above solutions for the determination of recovery, precision, accuracy, and limits of detection and quantitation. All standard solutions were covered with aluminum foil to protect from the light and stored at 4°C until used.
HPLC-MS instrumentation and conditions
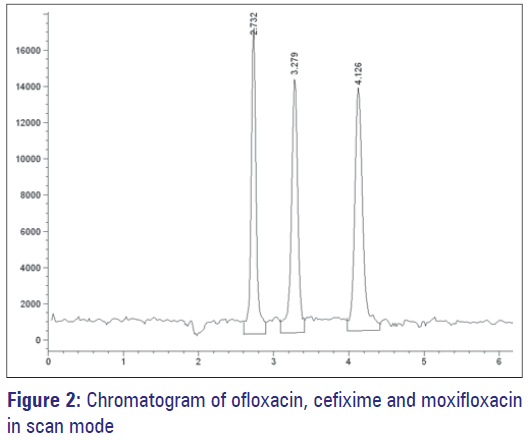
The Agilent LC-MS system consisted of Quat pump, an auto injector, degasser with Agilent Chem station data module (Agilent 1200 series, Germany) and Quadrupole LC-MS 6120 detector. Zorbax eclipse C18 (150 mm × 4.6 mm i.d, 5 μm) reverse phase analytical column was selected to separate active ingredients. The mobile phase was prepared by mixing acetonitrile, methanol and an aqueous formic acid solution (0.5%) in a ratio of 23:10:67 respectively and the mobile phase was filtered through a 0.45 μm nylon filter just before use. Isocratic HPLC was performed by setting the flow-rate at 0.6 mL/min and temperature at 25°C. The analyte responses were recorded by monitoring the eluate by MS detector. Area integration, peak area measurement, calculations, and the plotting of the chromatograms were performed by Agilent Chemdraw program. Time of analysis was 5 min. The analytes were ionized by an electrosprey ionization (ESI) source in positive ion mode. The following source conditions were used for the ionization of analytes: nebulizing gas (N2) 10 l/min; drying gas (N2) temperature 250°C; electrospary probe (capillary) voltage 3900 V; skimmer voltage 90V; cone voltage 4. First data acquisition was performed with scan mode (200-500) to know the molecular ion peaks of all the three compound. [Figure 2]. Further study was performed by selected ion monitoring (M + H) + for OFL at m/z 362.0, CEF at m/z 453.8 and internal standard (IS ) at m/z 402.0.
Preparation of stock and standard solutions
Stock solutions of OFL, CEF, and MOX were prepared by dissolving accurately weighed amounts of each reference compound in methanol to yield concentrations of 10 μg/ mL. These stock solutions were stored at 4°C and thawed on the day of analysis. The required different concentration solutions were prepared by diluting the above solutions in the mobile phase.
Preparation of plasma samples
Drug free blood samples were collected from healthy human volunteers, spiked with suitable volumes of the standard solutions of OFL and CEF followed by MOX and centrifuged for 5 min at 8,000 rpm. 200 μL of plasma was transferred into an eppendorf micro centrifuge tube and 400 μL of acetonitrile was added to precipitate proteins. The suspension was properly mixed using a vortex mixer (Stuart Scientific, UK) for 5 min and centrifuged at 13,000 rpm for 10 min (Eppendorf Centrifuge, USA). Then, clear supernatant was filtered using syringe filter and 20 μL was injected into the HPLC system.
Procedures
Calibration, linearity
On a daily basis calibration standards in plasma were prepared by spiking 200 μL of blank drug free human plasma with appropriate volumes of standard solutions of both drugs to get final concentrations of 4, 50, 100, 200, 400, 500 ng/mL for OFL and 40, 100, 500, 2000, 4000, 6000 for CEF. The standard MOX solution was added to all the above solution to get a constant concentration of 500 ng/ml in each solution. The calibration samples were subjected to the above sample preparation procedure.
In order to determine the linearity of the method, spiked standard samples at six concentrations over the range 4-500 ng/mL of OFL and 40-6000 ng/mL of CEF with 500 ng/mL of IS were prepared. The analysis was performed in three separate analytical runs for three sets of above solutions. Calibration curves were constructed by the peak-area ratios of the analyte to the IS versus the nominal standard concentration adopting least-squares linear regression. The concentrations of the unknown samples were calculated using the linear regression equation. The sensitivity of this LCMS method was examined by the measurement of the lower limit of detection (LOD) and limit of quantitation (LOQ). The LOD and LOQ of the method were determined by the signal-tonoise ratio using the equations 3 S/N and 10 S/N respectively.
Specificity and selectivity
The specificity of the method was evaluated by analyzing processed blank drug free human plasma and spiked with OFL, CEF, and IS. The matrix effect was scrutinized by evaluating the response (peak area) of OFL and CEF in the reconstituted solution of plasma (spiked OFL and CEF into the blank plasma, n = 5) with that of the standard solution at the same nominal concentration. Plasma samples were prepared by adopting the procedure described in the sample preparation section.
Precision and accuracy
Inter and intraday precision values were estimated by assaying control plasma containing three different concentrations of 10, 100, 400 ng/mL of OFL and 100, 2000, and 4000 ng/mL of CEF. The relative standard deviation (RSD) was obtained by performing the experiment 5 times on 1 day and repeating for three separate days. Accuracy of the method was investigated as the percentage of supposed concentration.
Recovery
The absolute recoveries of OFL, CEF, and IS from plasma at above three concentrations were determined by injecting plasma samples and standard solutions into the chromatographic system. Peak area ratios of the analytes after extraction of plasma samples were compared with those of direct injection of standard solutions. The differences between the peak areas of these mixtures correspond to the ion suppression. The recoveries were determined in triplicate.
Stability studies
Three replicates of samples at each of 10, 100, 400 ng/mL of OFL and 100, 2000, and 4000 ng/mL of CEF concentrations were used to assess the stability of OFL and CEF in human plasma under a different storage circumstances: three cycles of freezing (−20°C) thawing (25°C) stability, post-preparative stability (room temperature for 24 h) and long-term storage stability at−20°C for 15 days. Samples were concluded to be stable at verity of experimental conditions if the average deviations were within ± 15% of the actual valve.
Results and Discussion
Method optimization
Different mobile phase was screened to achieve favorable separation and a mixture of acetonitrile, methanol, and water was found to be optimal. Ammonium acetate, formic acid, and acetic acid additives were explored for separation with good resolution and for appropriate ionization of analytes. It was found that ammonium acetate ionized the OFL but failed to ionize CEF completely. However, formic acid and acetic acid showed good ionization of both the drugs, with formic acid modifier showed increased sensitivity and maintained sharp and symmetrical peaks for both analytes. The percentage of formic acid in water was studied and 0.5% was found to be optimal. The mobile consisting of acetonitrile:Methanol:Water with 0.5% formic acid in the ratio 23:10:67% demonstrated good linearity.
The OFL, CEF, and IS were analyzed by MS in ESI positive ion mode. The negative ion mode was also tested, but the positive ion mode sensitivity was higher than that of negative ion mode. The ESI revealed better signals for the protonated molecules of OFL, CEF, and MOX compared to atmospheric pressure chemical ionization (APCI). The chromatogram of the mass spectrum in scan mode gave most sensitive ions of (M + H) + at 90 eV for OFL, CEF, and IS. The most sensitive ions were (M + H) +, hence, the quantitative analysis was performed in selected ion monitoring (SIM) mode for OFL at 362.0 m/z, CEF at 453.8 m/z and IS at 402.0 m/z. The analyte peaks were confirmed by matching their retention times and mass spectra with solutions of standards.
Method validation
The correlation coefficients obtained (>0.999) confirmed that the calibration curves were linear over the range of 4-500 ng/mL for OFL and 40-6000 ng/mL for CEF in the human plasma. The regression equations constructed from the calibration curves were y = 5.19 x10-3 × 2.87x10-3 and y = 6.34x10⁻³ × − 2.38x10⁻³ with a correlation coefficient (r value) of 0.9996 and 0.9998 for OFL and CEF, respectively, where “y” represents the ratios of OFL and CEF peak areas to that of IS. And “x” represents the plasma concentration of OFL and CEF. The lower limit of quantitation (LLOQ) was 4 and 40 ng/mL and the LOD was 1.31 ng/mL and 13.4 ng/mL for OFL and CEF, respectively.
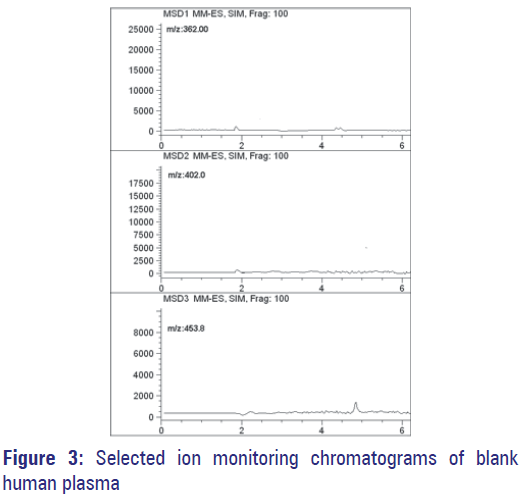
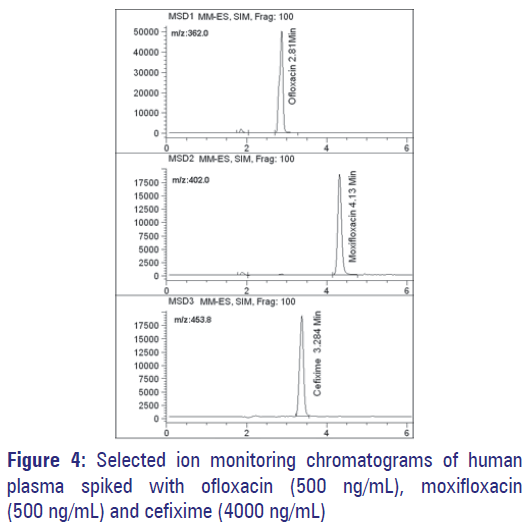
Figure 3 show selected-ion recording chromatograms acquired from an extract of the drug free-plasma sample. Figure 4 show chromatograms acquired from a spiked plasma sample containing 500 ng/mL of OFL, 4000 ng/mL of CEF and 500 ng/mL of MOX (IS). Under expressed chromatographic conditions, retention times were 2.81 min for OFL, 3.28 min for CEF and 4.13 min for MOX. Assays performed on drugfree human plasma succeeded to show no interfering peaks during the interested intervals of the retention times.
The results of intra and inter-day precision and accuracy are tabulated in the Table 1. The RSD was calculated and the results indicate that tested samples satisfy the requirements of biological analysis.
| Expected (ng/mL) | Intraday (n-5) | Interday (n-15) | Accuracy (%) | Recovery (%) | Quotient*(%) (Ion.Supp %) | ||
|---|---|---|---|---|---|---|---|
| Measured (ng/mL) | RSD (%) | Measured (ng/mL) | RSD (%) | ||||
| Ofloxacin | |||||||
| 10 | 9.81±0.53 | 5.40 | 10.16±0.72 | 7.09 | 98.4±7.7 | 90.7±8.1 | 95.4 (4.6) |
| 100 | 99.82±2.8 | 2.81 | 98.09±6.61 | 6.74 | 99.2±5.5 | 95.2±3.1 | 93.8 (6.2) |
| 400 | 392.69±12.95 | 3.30 | 396.05±18.9 | 4.77 | 98.6±4.6 | 93.4±5.0 | 96.4 (3.6) |
| Average | 98.6±5.9 | 93.1±5.4 | |||||
| Cefixime | |||||||
| 100 | 98.38±3.02 | 3.07 | 99.07±4.39 | 4.43 | 99.1±4.8 | 93.1±4.5 | 95.6 (4.5) |
| 2000 | 1962.39±80.23 | 4.09 | 2041.28±104.83 | 5.14 | 99.4±2.4 | 90.5±5.1 | 92.9 (7.1) |
| 4000 | 3942.73±171.09 | 4.34 | 3922.21±199.4 | 5.08 | 98.3±5.3 | 94.3±4.8 | 91.3 (8.7) |
| Average | 98.9 ±4.0 | 92.6±4.8 | |||||
*Peak height ratios between a spiked solution of prepared blank serum and a solution without sample preparation at the same concentrations, RSD: Relative standard deviation
Table 1: Intraday and interday precision and accuracy for ofloxacin and cefixime
The mean recoveries of OFL and CEF from spiked human plasma were 93.1 ± 5.4% and 92.63 ± 4.8%, respectively. The recovery of the IS was 94.2 ± 5.0% at the concentration of 500 ng/mL. These results showed that this method accomplish the high degree of reproducibility and accuracy. The ion suppression was found in the range of 3.6-8.1% [Table 1], which was relatively small, hence complicated sample preparation like liquid-liquid extraction or solid phase extraction was not used.
The results of the stability experiments indicate that there was no significant difference in plasma samples after three freeze-thaw cycles. In extracts, the analytes were stable after storage at room temperature for 24 h, and the plasma samples were also stable after storage at −20°C at least for 2 weeks [Table 2].
| Ofloxacin spiked concentration (ng/mL) | 10 | 100 | 400 |
|---|---|---|---|
| Measured concentration (ng/mL) | |||
| Freeze and thaw stability | |||
| Mean ± SD | 9.88±0.3 | 98.02±2.9 | 393.21±15.2 |
| RE (%) | −2.2 | −1.2 | −1.7 |
| Post-preparative stability (24 h at room temperature) | |||
| Mean ± SD | 10.27±0.2 | 98.1±3.8 | 391.65±16.6 |
| RE (%) | 2.7 | −1.9 | −2.08 |
| Stability for 15 days at −20°C | |||
| Mean ± SD | 9.75±0.3 | 97.3±3.2 | 395.5±20.8 |
| RE (%) | −2.5 | −2.7 | −1.12 |
| Cefixime trihydrate spiked concentration (ng/mL) | 100 | 2000 | 4000 |
| Measured concentration (ng/mL) | |||
| Freeze and thaw stability | |||
| Mean ± SD | 98.6±2.2 | 1965.7±43.9 | 3945.9±135.2 |
| RE (%) | −1.4 | −1.71 | −1.35 |
| Post-preparative stability (24 h at room temperature) | |||
| Mean ± SD | 101.2±4.6 | 1958.1±69.8 | 3853.5±116.6 |
| RE (%) | 1.27 | −2.1 | −3.65 |
| Stability for 15 days at −20°C | |||
| Mean ± SD | 97.31±2.8 | 1949.3±57.2 | 3909.8±110.8 |
| RE (%) | −2.69 | −2.53 | −2.25 |
RE: Relative error, SD: Standard deviation
Table 2: Stability of ofloxacin and cefixime trihydrate in human plasma
Conclusions
The objective of the present work was achieved by developing a specific, rapid, sensitive, and inexpensive LCMS method for determination of OFL and CEF in plasma and validated. Further, the simple sample preparation method was developed and the analytes were separated on a reversed phase column with MS detection. The specificity test showed that no additional peaks due to endogenous substances were observed that would interfere with OFL and CEF. In addition, the high accuracy, precision, recovery, and low detection limits allow to use the newly developed a procedure for pharmacokinetic and clinical studies.
Acknowledgments
Author wishes their sincere thanks to Dr. Ibrahim Alhaider, Dean, College of Clinical Pharmacy, King Faisal University, KSA for providing necessary facilities for work and to Health Center, King Faisal University, for providing blood samples.
References
- Ichihara N, T achizawa H, Tsum ura M, Une T, Sato K. Phase I study on DL-8280. Chemotherapy (Tokyo) 1984;32:118-49.
- Hooper DC, Wolfson JS. Mechanisms of quinolone action and bacterial killings. Quinolone Antimicrobial Agents. 2nd ed. Vol. 1. Washington DC: American Society for Microbiology; 1993. p. 53-7.
- McMillan A, Young H. The treatment of pharyngeal gonorrhoea with a single oral dose of cefixime. Int J STD AIDS 2007;18:253-4.
- Zhao G, Miller MJ, Franzblau S, Wan B, Möllmann U. Syntheses and studies of quinolone-cephalosporins as potential anti-tuberculosis agents. Bioorg Med Chem Lett 2006;16:5534-7.
- Wu DH. A review of the safety profile of cefixime. Clin Ther 1993;15:1108-19.
- Georgopapadakou NH, Bertasso A. Mechanisms of action of cephalosporin 3’-quinolone esters, carbamates, and tertiary amines in Escherichia coli. Antimicrob Agents Chemother 1993;37:559-65.
- Sakane K, Kawabata K, Inamoto Y, Yamanaka H, Takaya T. Research and development of new oral cephems, cefixime and cefdinir. Yakugaku Zasshi 1993;113:605-26.
- Okeri HA. Arhewoh IM. Analytical profile of the fluoroquinolone antibacterials ofloxacin. Afr J Biotechnol 2008;7:670-80.
- Khandagle KS, Gandhi SV, Deshpande PB, Kale AN, Deshmukh PR. High performance thin layer chromatographic determination of cefixime and ofloxacin in combined tablet dosage form. J Chem Pharm Res 2010;2:92-6.
- Attimarad M. Simultaneous determination of ofloxacin and flavoxate hydrochloride by absorption ratio and second derivative UV spectrophotometry in tablets. J Basic Clin Pharm 2011;2:53-61.
- Shah J, Jan MR, Shah S, Inayatullah. Spectrofluorimetric method for determination and validation of cefixime in pharmaceutical preparations through derivatization with 2-cyanoacetamide. J Fluoresc 2011;21:579-85.
- BukhariN, Al-Warthan A, Wabaidur SM, Othman ZA, Javid M, Haider S. Spectrofluorimetric determination of cefixime in pharmaceutical preparation and biological fluids using calcein as a fluorescence probe. Sens Lett 2010;8:280-4.
- Kaur K, Singh B, Malik AK. Micelle enhanced spectrofluorimetric method for the determination of ofloxacin and lomefloxacin in human urine and serum. Thai J Pharm Sci 2010;34:58-66.
- Kraemer HJ, Gehrke R, Breithaupt A, Breithaupt H. Simultaneous quantification of cefotaxime, desacetylcefotaxime, ofloxacine and ciprofloxacine in ocular aqueous humor and in plasma by highperformance liquid chromatography. J Chromatogr B Biomed Sci Appl 1997;700:147-53.
- Zendelovska D, Stafilov T, Miloševski P. High-Performance liquid chromatographic method for determination of cefixime and cefotaxime in human plasma. Bull Chemists Technol Macedonia 2003;22:39-45.
- Espinosa-Mansilla A, Peña AM, Gómez DG, Salinas F. HPLC determination of enoxacin, ciprofloxacin, norfloxacin and ofloxacin with photoinduced fluorimetric (PIF) detection and multiemission scanning: Application to urine and serum. J Chromatogr B Analyt Technol Biomed Life Sci 2005;822:185-93.
- Garcia M, Solans C, Calvo A, Royo M, Hernandez E, Rey R,. Bregante MA. Analysis of ofloxacin in plasma samples by high-Performance liquid chromatography. Chromatographia 2002;55:431-4.
- Ohkubo T, Kudo M, Sugawara K. Determination of ofloxacin in human serum by high-performance liquid chromatography with column switching. J Chromatogr 1992;573:289-93.
- Lee HB, Peart TE, Svoboda ML. Determination of ofloxacin, norfloxacin, and ciprofloxacin in sewage by selective solid-phase extraction, liquid chromatography with fluorescence detection, and liquid chromatography – Tandem mass spectrometry. J Chromatogr A 2007;1139:45-52.
- Gaillard Y, Pépin G. Use of high-performance liquid chromatography with photodiode-array UV detection for the creation of a 600-compound library. Application to forensic toxicology. J Chromatogr A 1997;763:149-63.
- Dhoka MV, Sandage SJ, Dumbre SC. Simultaneous determination of cefixime trihydrate and dicloxacillin sodium in pharmaceutical dosage form by reversed-phase high-performance liquid chromatography. J AOAC Int 2010;93:531-5.
- Amit JK, Vikram VS, Vikram VW. Simultaneous estimation of metronidazole and ofloxacin in combined dosage form by RP HPLC method. Int J Chem Technol Res 2009;1:1244-8.
- Pisarev VV, Zaitseva KV, Smirnova LB, Belolipetskaia VG, Kibal’chich DA, Koltunov IE. Determination of cefixime blood plasma levels by HPLC. Antibiot Khimioter 2009;54:37-40.
- Tang Wen-Y, Zhen-Yu Q, Heng Z. Detemination of cefixime in human plasma by HPLC-MS/MS. J Chin Mass Spectrom 2008;29:211-2.
- Meng F, Chen X, Zeng Y, Zhong D. Sensitive liquid chromatographytandem mass spectrometry method for the determination of cefixime in human plasma: Application to a pharmacokinetic study. J Chromatogr B Analyt Technol Biomed Life Sci 2005;819:277-82.
- Hernández M, Borrull F, Calull M. Determination of quinolones in plasma samples by capillary electrophoresis using solid-phase extraction. J Chromatogr B Biomed Sci Appl 2000;742:255-65.
- Honda S, Taga A, Kakehi K, Koda S, Okamoto Y. Determination of cefixime and its metabolites by high-performance capillary electrophoresis. J Chromatogr 1992;590:364-8.
- Liu YM, Shi YM, Liu ZL. Determination of enoxacin and ofl oxacin by capillary electrophoresis with electrochemiluminescence detection in biofl uids and drugs and its application to pharmacokinetics. Biomed Chromatogr 2010;24:941-7.
- See KL, Elbashir AA, Saad B, Ali AS, Aboul-Enein HY. Simultaneous determination of ofl oxacin and ornidazole in pharmaceutical preparations by capillary zone electrophoresis. Biomed Chromatogr 2009;23:1283-90.
- Horstkötter C, Blaschke G. Stereoselective determination of ofloxacin and its metabolites in human urine by capillary electrophoresis using laser-induced fluorescence detection. J Chromatogr B Biomed Sci Appl 2001;754:169-78.


