

3D QSAR studies on a series of Quinazoline derrivatives as tyrosine Kinase (EGFR) inhibitor: the k-nearest Neighbor molecular field Analysis approach
- *Corresponding Author:
- M.N.Noolvi
Department of Pharmaceutical Chemistry, ASBASJSM College of Pharmacy, Bela (Ropar)-14011, Punjab, India
E-mail: mnoolvi@yahoo.co.uk
Date of Received : 12-04-2010
Date of Modefied : 03-05-2010
Date of Accepted : 10-06-2010
Available Online : 15-08-2010
Abstract
Epidermal growth factor receptor (EGFR) protein tyrosine kinases (PTKs) are known for its role in cancer. Quinazoline have been reported to be the molecules of interest, with potent anticancer activity and they act by binding to ATP site of pro-tein kinases. ATP binding site of protein kinases provides an extensive opportunity to design newer analogs. With this background, we report an attempt to discern the structural and physicochemical requirements for inhibition of EGFR tyrosine kinase. The k-Nearest Neighbor Molecular Field Analysis (kNN-MFA), a three dimensional quantitative structure activity relationship (3D- QSAR) method has been used in the present case to study the correlation between the molecular properties and the tyro-sine kinase (EGFR) inhibitory activities on a series of quinazoline derivatives. kNN-MFA calculations for both electrostatic and steric field were carried out. The master grid maps derived from the best model has been used to display the contribution of electrostatic potential and steric field. The statistical results showed significant cor-relation coefficient r2 (q2) of 0.846, r2 for external test set (pred_r2) 0.8029, coefficient of correlation of predicted data set (pred_r2se) of 0.6658, degree of freedom 89 and k nearest neighbor of 2. Therefore, this study not only casts light on binding mechanism between EGFR and its inhibitors, but also provides hints for the design of new EGFR inhibitors with observable structural diversity
Keywords
Quinazoline, Tyrosine kinase (E GFR), k-Nearest Neighbor Molecular Field Analysis (kNN-MFA).
Introduction
Many of the tyrosine kinase enzymes are involved in cellular signaling pathways and regulate key cell functions such as proliferation, diff erentiation, anti-apoptotic signaling and neurite outgrowth. Unregulated activation of these enzymes, through mechanisms such as point mutations or over expression, can lead to a large percentage of clinical cancers [1,2]. The importance of tyrosine kinase enzymes in health and disease is further underscored by the existence of aberrations in tyrosine kinase enzymes signaling occurring in infl ammatory diseases and diabetes. Inhibitors of tyrosine kinase as a new kind of eff ective anticancer drug are important mediators of cellular signal transduction that aff ects growth factors and oncogenes on cell proliferation [3,4]. The development of tyrosine kinase inhibitors has therefore become an active area of research in pharmaceutical science. Epidermal growth factor receptor (EGFR) which plays a vital role as a regulator of cell growth is one of the intensely studied tyrosine kinase targets of inhibitors. EGFR is overexpressed in numerous tumors, including those derived from brain, lung, bladder, colon, breast, head and neck. EGFR hyper activation has also been implicated in other diseases including polycystic kidney disease, psoriasis and asthma [5-7]. Since the hyper activation of EGFR has been associated with these diseases, inhibitor of EGFR has potential therapeutic value and it has been extensively studied in the pharmaceutical industry.
One could not, however, confi rm that the compounds designed would always possess good inhibitory activity to EGFR, while experimental assessments of inhibitory activity of these compounds are time-consuming and expensive. Consequently, it is of interest to develop a prediction method for biological activities before the synthesis. Quantitative structure activity relationship (QSAR) searches information relating chemical structure to biological and other activities by developing a QSAR model. Using such an approach one could predict the activities of newly designed compounds before a decision is being made whether these compounds should be really synthesized and tested.
Many diff erent approaches to QSAR have been developed over the years. The rapid increase in threedimensional structural information (3D) of bioorganic molecules, coupled with the development of fast methods for 3D structure alignment (e.g. active analogue approach), has led to the development of 3D structural descriptors and associated 3D QSAR methods. The most popular 3D QSAR methods are comparative molecular field analysis (CoMFA) and comparative molecular similarity analysis (CoMSIA) [8,9]. The CoMFA method involves generation of a common three dimensional lattice around a set of molecules and calculation of the steric and electrostatic interaction energies at the lattice points. The interaction energies are numerically very high when a lattice point is very close to an atom and special care needs to be taken in order to avoid problems arising because of this. The CoMSIA method avoids these problems by using similarity function represented as Gaussian. Th is information around the molecule is converted into numerical data using the partial least squares (PLS) method that reduces the dimensionality of data by generating components. However, a major disadvantage is that PLS attempts to fit a linear curve among all the points in the data set. Further, the PLS method does not off er scope for improvement in results. It has been observed from several reports that the predictive ability of PLS method is rather poor due to fitting of a linear curve between the available points. In the case of the CoMSIA method, molecular similarity is evaluated and used instead of molecular field, followed by PLS analysis.
Variable selection methods have also been adopted for optimal region selection in 3D QSAR methods and shown to provide improved QSAR models as compared to the original CoMFA technique. For example, GOLPE was developed using chemometric principles, and q2-GRS was developed on the basis of independent analyses of small areas (or regions) of near molecular space to address the issue of optimal region selection in CoMFA [10,11]. These considerations provide an impetus for the development of fast, generally nonlinear, variable selection methods for performing molecular field analysis. With the above facts and in continuation of our research for newer anti-cancer agent [12,13] in the present study, we report here the development of a new method (kNN-MFA) that adopts a k-nearest neighbor principle for generating relationships of molecular fields with the experimentally reported activity to provide further insight into the key structural features required to design potential drug candidates of this class. Th is method utilizes the active analogue principle that lies at the foundation of medicinal chemistry.
Computational Methods
A. Methodology
We hereby report the models, as generated by kNN-MFA in conjunction with stepwise (SW) forward-backward variable selection methods. In the kNN-MFA method, several models were generated for the selected members of training and test sets, and the corresponding best models are reported herein. VLife Molecular Design Suite (VLifeMDS), allows user to choose probe, grid size, and grid interval for the generation of descriptors. The variable selection methods along with the corresponding parameters are allowed to be chosen, and optimum models are generated by maximizing q2. k-nearest neighbor molecular field analysis (kNN-MFA) requires suitable alignment of given set of molecules. Th is is followed by generation of a common rectangular grid around the molecules. The steric and electrostatic interaction energies are computed at the lattice points of the grid using a methyl probe of charge +1. These interaction energy values are considered for relationship generation and utilized as descriptors to decide nearness between molecules. The term descriptor is utilized in the following discussion to indicate field values at the lattice points. The optimal training and test sets were generated using the sphere exclusion algorithm [14]. Th is algorithm allows the construction of training sets covering descriptor space occupied by representative points. Once the training and test sets were generated, kNN methodology was applied to the descriptors generated over the grid.
Nearest Neighbor (kNN) Method
The kNN methodology relies on a simple distance learning approach whereby an unknown member is classifi ed according to the majority of its k-nearest neighbors in the training set. The nearness is measured by an appropriate distance metric (e.g., a molecular similarity measure calculated using field interactions of molecular structures). The standard kNN method is implemented simply as follows: Calculate distances between an unknown object (u) and all the objects in the training set; select k objects from the training set most similar to object u, according to the calculated distances; and classify object u with the group to which the majority of the k objects belongs. An optimal k value is selected by optimization through the classifi cation of a test set of samples or by leaveone out cross-validation [15].
kNN-MFA with Simulated Annealing
Simulated annealing (SA) is the simulation of a physical process, ‘annealing’, which involves heating the system to a high temperature and then gradually cooling it down to a preset temperature (e.g., room temperature). During this process, the system samples possible confi gurations distributed according to the Boltzmann distribution so that at equilibrium, low energy states are the most populated.
kNN-MFA with Stepwise (SW) Variable Selection
Th is method employs a stepwise variable selection procedure combined with kNN to optimize the number of nearest neighbors (k) and the selection of variables from the original pool as described in simulated annealing.
kNN-MFA with Genetic Algorithm
Genetic algorithms (GA) fi rst described by Holland [16] mimic natural evolution and selection. In biological systems, genetic information that determines the individuality of an organism is stored in chromosomes. Chromosomes are replicated and passed onto the next generation with selection criteria depending on fi tness.
Chemical Data
One hundred twenty six quinazoline derivatives as tyrosine kinase (EGFR) inhibitors were taken from the literature and used for kNN-MFA analysis [17-28]. The above reported quinazoline derivatives showed wide variation in their structure and potency profi les. kNN-MFA (3DQSAR) models were generated for these derivatives using a training set of 98 molecules. Predictive power of the resulting models was evaluated by a test set of 28 molecules with uniformly distributed biological activities. Selection of test set molecules was made by considering the fact that test set molecules represent structural features similar to compounds in the training set [29]. The structures of all compounds along with their actual and predicted biological activities are shown in Table 1(A-Y).
Table 1 (A-W): Structure, Experimental and Predicted Activity of Quinazolines Used in Training and Test Set using model 1

Biological activities
126 quinazoline derivatives having diff erent substitution were divided into two sets, 98 (75%) molecules were taken for the training set and 28 (25%) compounds were taken in for the test set. IC50 (μM) values for EGFR inhibition were transformed into –log (IC50* 10-6) i.e. pIC50 [30]. Since some compounds exhibited insignifi cant/no inhibition, such compounds were excluded from the present study. All the IC50 values had been obtained using the in vitro MTT assay method [31,32]. The IC50 values of reference compounds were checked to ensure that no difference occurred between different groups. The pIC50 values of the molecules under study spanned a wide range from 5 to 9.
Data Set
All computational work was performed on Apple workstation (8-chore processor) using Vlife MDS QSAR plus software developed by Vlife Sciences Technologies Pvt Ltd, Pune, India, on windows XP operating system . All the compounds were drawn in Chem DBS using fragment database and then subjected to energy minimization using batchenergy minimization method.
Molecular Modeling and Alignment
Conformational search were carried out by systemic conformational search method and lowest energy conformers were selected. All the compounds were aligned by template based method. The selection of template molecule for alignment was done by considering the following facts: a) the most active compound; b) the lead or commercial compound; c) the compound containing the greatest number of functional group [33,34 ]. Generally, the low energy conformer of the most active compound is selected as a reference [35]. In the present study, all the compounds were aligned against minimum energy conformation of most active compound no.28 (Figure 1) by using quinazoline nucleus as template shown in Figure 2.

Figure 1: Reference molecule (28) used for alignment by template based alignment

Figure 2: Quinazoline moiety as a template for alignment
Selection of Training and Test Set
The dataset of 126 molecules was divided into training and test set by Sphere Exclusion (SE) method for model 1, model 2 and model 3 having dissimilarities values of 8.2, 8.3 and 8.1 respectively with pIC50 activity field as dependent variable and various 3D descriptors calculated for the compounds as independent variables.
Cross-Validation Using Weighted K-Nearest Neighbor.
Th is is done to test the internal stability and predictive ability of the QSAR models. Developed QSAR models were validated by the following procedure:
a) Internal Validation
(1) A molecule in the training set was eliminated, and its biological activity was predicted as the weighted average activity of the k most similar molecules (eq. 1). The similarities were evaluated as the inverse of Euclidean distances between molecules (eq. 2) using only the subset of descriptors corresponding to the current trial solution
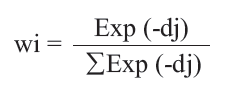
k –Nearest neighbor
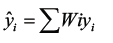 (1)
(1)
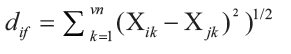 (2)
(2)
(2) Step 1 was repeated until every molecule in the training set has been eliminated and its activity predicted once.
(3) The cross-validated r2 (q2) value was calculated using eq. 3, where yi and ŷ are the actual and predicted activities of the ith molecule, respectively, and ymean is the average k-Nearest neighbor activity of all molecules in the training set. Both summations are over all molecules in the training set. Since the calculation of the pairwise molecular similarities, and hence the predictions, were based upon the current trial solution, the q2 obtained is indicative of the predictive power of the current kNN-MFA model.
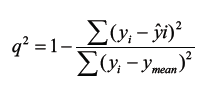 (3)
(3)
b) External Validation
The predicted r2 (pred_r2) value was calculated using eq 4, where yi and yˆi are the actual and predicted activities of the ith molecule in test set, respectively, and y mean is the average activity of all molecules in the training set. Both summations are over all molecules in the test set. The pred_r2 value is indicative of the predictive power of the current kNN-MFA model for external test set.
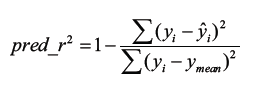 (4)
(4)
Both summations are over all molecules in the test set. Th us, the pred_r2 value is indicative of the predictive power of the current model for external test set.
c) Randomization Test
To evaluate the statistical signifi cance of the QSAR model for an actual data set, we have employed a one-tail hypothesis testing [36–37]. The robustness of the QSAR models for experimental training sets was examined by comparing these models to those derived for random data sets. Random sets were generated by rearranging biological activities of the training set molecules. The signifi cance of the models hence obtained was derived based on calculated Z score [36–37].
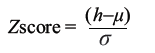 (5)
(5)
where h is the q2 value calculated for the actual dataset, μ the average q2, and σ is its standard deviation calculated for various iterations using models build by diff erent random datasets. The probability (α) of signifi cance of randomization test is derived by comparing Z score value with Z score critical value, if Z score value is less than 4.0; otherwise it is calculated by the formula as given in the literature. For example, a Z score value greater than 3.10 indicates that there is a probability (α) of less than 0.001 that the QSAR model constructed for the real dataset is random. The randomization test suggests that all the developed models have a probability of less than 1% that the model is generated by chance.
Experimental
All the one hundred twenty six compounds were built on workstation of molecular modeling software VlifeMDS, which is a product Vlife Sciences Pvt Ltd., India [38]. We hereby report the models, as generated by kNN-MFA in conjunction with stepwise (SW) forward-backward variable selection methods shown in Table 2.
In the present kNN-MFA study, (-13.2343 to 19.1320) × (-12.0268 to 15.04940) × (-11.2513 to 15.4959) A0grid at the interval of 2.00 was generated around the aligned compounds. The steric and electrostatic interaction energies are computed at the lattice points of the grid using a methyl probe of charge +1 of Gasteiger-Marsili type. These interaction energy values are considered for relationship generation and utilized as descriptors to decide nearness between molecules. The QSAR models were developed using forward-backward variable selection method with pIC50 activity field as dependent variable and physico-chemical descriptors as independent variable having cross-correlation limit of 1, 0.8 and 0.9 for mode 1, model 2 and model 3 respectively. Selection of test and training set was done by sphere exclusion method having dissimilarity value of 8.2, 8.3 and 8.1 for mode 1, model 2 and model 3 respectively. Variance cut off point was 0.0. Numbers of maximum and minimum neighbors were 5 and 2 respectively.
The method described above has been implemented in software, Vlife Molecular Design Suite (VlifeMDS), [38] which allows user to choose probe, grid size, and grid interval for the generation of descriptors. The variable selection methods along with the corresponding parameters are allowed to be chosen, and optimum models are generated by maximizing q2.
Steps Involved In kNN-MFA Method
1. Molecules are optimized before alignment optimization is done by MOPAC energy minimization and optimization is necessary process for proper alignment of molecules around template.
2. kNN-MFA method requires suitable alignment of given set of molecules, alignment are template based.
3.Th is is followed by generation of common rectangular grid around the molecules, the steric and electrostatic interaction energies are computed at the lattice points of the grid using a methyl probe of charge +1.
4.The optimal training and test set were generated using sphere exclusion method.
5. Model was generated by various kNN methods, and models validated internally and externally by leave one out, external validation.
6. Predict the activity of test set of compounds.
Since the fi nal equations are not very useful to represent effi ciently the kNN-MFA models, 3D master grid maps of the best models are displayed. They represent area in space where steric and electrostatic field interactions are responsible for the observed variation of the biological activity.
Result and Discussion
Training set of 98 and test set of 28 quinazoline derivatives having diff erent substitution were employed. Following statistical measure was used to correlate biological activity and molecular descriptors: n = number of molecules, Vn= number of descriptors, k = number of nearest neighbor, df =degree of freedom, r2 = coeffi cient of determination, q2 = cross validated r2 (by the leave-one out method), pred_r2 = r2 for external test set, pred_r2se = coeffi cient of correlation of predicted data set, Z score = the Z score calculated by q2 in the randomization test, best_ran_q2 = the highest q2 value in the randomization test and α = the statistical signifi cance parameter obtained by the randomization test.
Selecting training and test set by spherical exclusion method, Unicolumn statics shows that the max of the test is less than max of train set and the min of the test set is greater than of train set shown in Table 3, which is prerequisite analysis for further QSAR study. The above result shows that the test is interpolative i.e. derived within the min-max range of the train set. The mean and standard deviation of the train and test provides insight to the relative difference of mean and point density distribution of the two sets. In this case the mean in the test set higher than the train set shows the presence of relatively more active molecules as compared to the inactive ones. Also the similar standard deviation in both set indicates that the spread in both the set with their respective mean is comparable.
| Parameters | Model 1 | Model 2 | Model 3 |
|---|---|---|---|
| (Dissimilarity value =8.2) | (Dissimilarity value =8.3) | (Dissimilarity value =8.1) | |
| n | 98 | 98 | 98 |
| k | 2 | 2 | 2 |
| q2 | 0.8463 | 0.7487 | 0.7802 |
| pred_r2 | 0.8029 | 0.7192 | 0.7412 |
| pred_r2se | 0.6658 | 0.7126 | 0.6533 |
| Z score | 15.25775 | 11.5635 | 14.23195 |
| best_ran_q2 | 0.03060 | 0.1225 | 0.1092 |
| a _ran_q2 | 0.0001 | 0.001 | 0.001 |
| E_1882 (6.6335, 8.2052) | E_1882 (6.6335, 8.2052) | S_1099 (11.5811, 12.2127) | |
| S_1462 (30.0000, 30.0000) | E_2289 (-1.6082,-0.7847) | ||
| E_1515 (-0.1446, 0.2255) | |||
| E_2289 (-1.3653,-1.1622) | S_1631 (-0.3820,-0.2460) | ||
| Descriptors | S_2892 (-0.0329, -0.0067) | ||
| E_2287 (0.1633, 0.2380) | E_1911 (-3.9843,-33125) | ||
| S_1462 (30.0000, 30.0000) | |||
| E_2615 (-0.0583, 0.0815) | E_2272 (-0.3129,-0.1297) | ||
| S_734 (-0.0194 -0.0098) | |||
| E_2874 (0.0617, 0.0680) | S_512 (-0.0214,-0.0165) | ||
| Vn | 06 | 05 | 06 |
Table 2: Stastical Results of kNN-MFA method.
| Unicolumn Statics | Average | Max | Min | Std. Deviation |
|---|---|---|---|---|
| For Training Set | 6.4542 | 8.7447 | 4.6985 | 1.1079 |
| For Test Set | 6.8568 | 8.1938 | 5.3872 | 0.7417 |
Table 3: Unicolumn Statics of Training and Test Set.
The activity distribution graph shows the comparison between the activity of training and test set. It can be observed from Hierarchical Graph that the test set molecule activities lie within the range of training set, shown in Figure 3.

Figure 3: Hierarchical Graph Showing Uniform Distribution of Training and Test Set.
The observed and predicted pIC50 along with residual values for model 1 are shown in Table 1(A-W). The plot of observed vs. predicted activity is shown in Figure 4 From the plot it can be seen that kNN-MFA model is able to predict the activity of training set quite well (all points are close to regression line) as well as external.

Figure 4: Graph of Actual vs. Predicted activities for training and test set molecules from the kNN-MFA model 1, A) Training set (Blue dots) B) Test Set (Yellow dots).
During the kNN-MFA investigation, dissimilarity value for the selection of training and test by spherical exclusion method of range 8.0000 to 9.5000 were investigated. The dissimilarity value of 8.200 produced a signifi cant result as compare to the 8.100 and 8.300 shown in Table 2. Further increase in resolution have produced decrease in model quality. From the Table 2 it was observed that the results were less sensitive to resolution of dissimilarity value.
It is known that the CoMFA method provides signifi cant value in terms of a new molecule design, when contours of the PLS coeffi cients are visualized for the set of molecules. Similarly, the kNN-MFA models provide direction for the design of new molecules in a rather convenient way. The points which contribute to the kNN-MFA models 1 is displayed in Figure 5. The range of property values for the chosen points may aid in the design of new potent molecules (Figure 5). The range is based on the variation of the field values at the chosen points using the most active molecule and its nearest neighbor set.

Figure 5: 3D- alignment of molecule with the important steric and electrostatic point contributing to the model with range of values shown in parenthesis
The q2, pred_r2, Vn and k value of kNN-MFA with model 1, 2 and 3 were (0.8463, 0.8029, 06/2) (0.7487, 0.7192, 05/2) and (0.7802, 0.7412, 06/2) respectively. Among these three methods, model 1 have better q2 (0.8463) and pred_r2(0.8029) than other two models, model 1correctly predicts activity 84.63% and 80.29% for the training and test set respectively. It uses 1 steric and 5 electronic descriptors with 2 k nearest neighbor to evaluate activity of new molecule.
The model is validated by α_ran_q2 = 0.0001, best_ran_q2 = 0.03060, and Z score_ran_q2 =15.25775 .The randomization test suggests that the developed model have a probability of less than 1% that the model is generated by chance.
The kNN MFA models obtained by using all the three dissimilarity values showed that electrostatic and steric interactions plays major role in determining biological activity.S_1462 in model 1, S_1462, S_2892, S_734 in model 2 and S_1099, S_1631, S_512 in model 3 are steric field descriptors similarly E_1882, E_2289, E_2287, E_2615, E_2874 in model 1, E_1515, E_1882 in model 2, and E_2289, E_1911, E_2272 model 3 are electrostatic field descriptors. It can also be noted that electrostatic descriptor E_1882 and steric descriptor S_1462 was common in the Model 1 and Model 2 using forwardbackward variable selection method implying the signifi cant role of these descriptors in electrostatic and steric field interaction for the structure activity relationship.
Negative value in electrostatic field descriptors indicates that negative electronic potential is required to increase activity and more electronegative substituents group is preferred in that position, positive range indicates that group that imparting positive electrostatic potential is favorable for activity so less electronegative group is preferred in that region. Similarly negative range in steric descriptors indicates that negative steric potential is favorable for activity and less bulky substituents group is preferred in that region, Positive value of steric descriptors reveals that positive steric potential is favorable for increase in activity and more bulky group is preferred in that region. n, number of observations (molecules); Vn, number of descriptors; k, number of nearest neighbors; q2,cross-validated r2 (by the leave-one out method); pred_r2, predicted r2 for the external test set; Zscore, the Zscore calculated by q2 in the randomization test; best_ran_q2, the highest q2 value in the randomization test and α _ran_q2, the statistical signifi cance parameter obtained by the randomization test.
Conclusion
In conclusion, the model developed to predict the structural features of quinazoline to inhibit EGFR tyrosine kinase, reveals useful information about the structural features requirement for the molecule. In all three optimized models, Model 1 is giving very signifi cant results. The master grid obtained for the various kNN-MFA models show that negative value in electrostatic field descriptors indicates the negative electronic potential is required to increase activity and more electronegative substituents group is preferred in that position, positive range indicates that the group which imparts positive electrostatic potential is favorable for activity so less electronegative group is preferred in that region. Negative range in steric descriptors indicates that negative steric potential is favorable for activity and less bulky substituents group is preferred in that region, Positive value of steric descriptors reveals that positive steric potential is favorable for increase in activity and more bulky group is preferred in that region. On the basis of the spatial arrangement of the various shapes, electrostatic and steric potential contributions model proposed in this work is useful in describing QSAR of quinazoline derivatives as EGFR tyrosine kinase inhibitor and can be employed to design new derivatives of quinazoline with specifc inhibitory activity.
Acknowledgements
The authors would like to thank Director General, Department of Science and Technology, New Delhi for funding the project (Grant.No.SR/FT/ LS-0083/2008) and Sardar Sangat Singh Longia, Secretary ASBASJSM College of Pharmacy for providing the necessary facilities.
References
- Kurup R, Garg C and Hansch. Chem. Rev. 2001; 101: 2573-2600..
- Palmer BD, Krake AJ, Hartl BG, et al. J. Med. Chem. 1999; 42: 2373- 2382.
- Oblak M, Randic M and Solmajer T. J. Chem. Inf. Comput. Sci. 2000; 40: 994-1001.
- Naumann T and Matter T. J. Med. Chem. 2002; 45: 2366-2378.
- Bridges AJ, Zhou H, Cody DR, et al. J. Med. Chem. 1996; 39: 267-276.
- Ma KA, Bower H, Lin G, et al. Biochem. Pharmacol. 2005:69:1785-1794.
- Albuschat R, Lowe W, Weber M, et al. Eur. J. Med. Chem. 2004; 39:1001-1011.
- Cramer RD, Patterson DE and Bunce JD. J. Am. Chem. Soc. 1988;110: 5959.
- Klebe G, Abraham U and Mietzner T. J. Med. Chem. 1994; 37: 24.
- Baroni M, Costantino G, Cruciani G, et al. An Advanced Chemometric Tool for Handling 3D-QSAR Problems. Quant. Struct.-Act. Relat. 1993; 12: 9.
- Cho SJ and Tropsha A. J. Med. Chem. 1995; 38: 1060.
- Manjula SN, Noolvi MN, Parihar KV, et al. Synthesis and anti-tumour activity of optically active thiourea and their 2-aminobenzothiazole derivatives: A novel class of anticancer agents. Eur. J. Med. Chem. 2009: 1-7.
- Badiger AM, Noolvi MN and Nayak PV. QSAR study of Benzthiazole derivatives as p56 lck inhibitors. Lett. Drug .Des. Discov. 2006; 3:550-560.
- Golbraikh A and Tropsha A. J. Chem. Inf. Comput. Sci. 2003; 43: 144.
- Sharaf MA, Illman DL and Kowalski BR. Chemometrics.Wiley, New York, 1986.
- Holland, J. Adaptation in Natural and Artifi cial Systems, University of Michigan Press, 1975.
- KitanoY, Suzuki T, Kawahara E, et al. Synthesis and inhibitory activity of 4-alkenylquinazolines: Identifi cation of new scaffolds for potent EGFR tyrosine kinase inhibitors. Bioorg. Med. Chem. Lett. 2007; 17: 5863-5867.
- Chandregowda V, Kush AK and Reddy C. Synthesis and in vitro antitumour activities of novel 4 – Anilinoquinazolines derivatives. Eur. J. Med. Chem. 2009; 44: 3046-3055.
- Mishani E, Abourbeh G, Rozen Y, et al. Novel carbon -11 labeled 4-dimethylamino but-2-enoic acid [4 –(phenylamino) –quinazoline-6-yl] –amides:potential PET bioprobes for molecular imaging of EFGR positive tumours. Nucl. Med. Biol. 2004; 31: 469-476.
- Dissoki S, Aviv Y, Laky D, et al. The effect of the [18F] – PEG group on tracer qualifi cation of [4-(phenylamino) – quinazoline-6-yl] –amide moiety – an EGFR putative irreversible inhibitor. .Int. J. Appl. Radiat. Isot . 2007; 65: 1140-1151.
- Abouzid K and Shouman S. Design, synthesis and in vitro anti-tumour activity of 4-aminoquinoline and 4-aminoquinazoline derivatives targeting EGFR tyrosine kinase. Bioorg. Med. Chem. 2008; 16: 7543-7551.
- Shaul M, Abourbeh G, Jacobson O, et al. Novel iodine -124 labeled EGFR inhibitors as potential PET agents for molecular maging in cancer. Bioorg. Med. Chem. 2004; 12: 3421-3429.
- Gibson KH, Grundy W, Godfrey AA, et al. Epidermal growth factor receptor tyrosine kinase: Structure activity relationship and anti-tumour activity of novel quinazoline. Bioorg. Med. Chem. Lett. 1997; 7: 2723-2728.
- Zhang Y, Cockrill S, Guntrip S, et al. Synthesis and SAR of potent EGFR / erB2 dual inhibitors. Bioorg. Med. Chem. Lett.,2004, 14: 111-114.
- Liu L, Yuan T, Liu H, et al. Synthesis and biological evaluation of substituted 6-alkynyl – 4 – Anilinoquinazolines derivatives as potent EGFR inhibitors. Bioorg. Med. Chem. Lett. 2007, 17; 63:73-6377.
- Bridges A, Cody D, Zhou H, et al.Enantioselective inhibition of the epidermal growth factor receptor tyrosine kinase by 4-( _- phenethylamino) quinazolines. Bioorg. Med. Chem. 1995; 3: 1651-1656.
- Lowe W and Luth AEJ .Synthesis of 4- ( indole -3-yl) quinazolines – A new class off epidermal growth factor receptor tyrosine kinase inhibitors. Eur. J. Med. Chem. 2008; 43: 1478-1488.
- Rachid Z, MacPhee M , Williams C, et al. Design and synthesis of new stabilized combi-triazenes for targeting solid tumours expressing the epidermal growth fator receptor (EGFR) or its closest homologue HER2. Bioorg. Med. Chem. Lett. 2009, article in press.
- Murthy VS and Kulkarni VM. 3D-QSAR CoMFA and CoMSIA on Protein Tyrosine Phosphatase 1B Inhibitors. Bioorg. Med. Chem. 2002; 10: 2267-2282.
- Sachan N, Kadam SS and Kulkarni VM. Human Protein Tyrosine Phosphatase 1B Inhibitors: QSAR by Genetic Function Approximation. J.Enzyme Inhib. Med. Chem. 2007; 22: 267-276.
- .Rusnak DW, Lackey K, Affl eck K, et al. Mol. Cancer. Ther. 2001; 1:85.
- .Skehan P, Storeng R, Scudiero D, et al. J. Natl. Cancer. Inst.1990; 82:1107.
- Agarwal A and Taylor EW. 3-D QSAR for intrinsic activity of 5-HT1a receptor ligands by the method of comparative molecular fi eld analysis. J. Computat. Chem.1993; 14: 237–245.
- Baurin N, Vangrevelinghe E and Allory LM. 3D-QSAR CoMFA study on imidazolinergic i2 igands: a signifi cant model through a combined exploration of structural diversity and methodology. J. Med. Chem. 2000; 43: 1109–1122.
- Xu M, Zhang A, Han S and Wang L. Studies of 3D-Quantitative Structure-Activity elationships on a set of nitroaromatic compounds: CoMFA advanced CoMFA and CoMSIA. Chemosphere. 2002; 48: 707-715.
- Zheng W and Tropsha A. J. Chem. Inf. Comput. Sci. 2000; 40: 185.
- Gilbert N, Statistics, Saunders WB Co, Philadelphia, PA. 1976.
- VLifeMDS2.0, Molecular Design Suite, Vlife Sciences Technologies Pvt. Ltd., Pune, India, 2004, (www.vlifesciences.com).