

QSAR Modeling, Docking, Scaffold Study, Synthesis and Characterization of Novel Sulfonamides Tested Against E. coli and Bacillus subtilis
- *Corresponding Author:
- Ajeet
School of Pharmaceutical Sciences, IFTM University, Moradabad, 244001, Uttar Pradesh, India.
E-mail: ajeet_pharma111@rediffmail.com
Citation: Ajeet A, Mishra AK, Kumar A. QSAR Modeling, Docking, Scaffold Study, Synthesis and Characterization of Novel Sulfonamides Tested Against E. coli and Bacillus subtilis. J Basic Clin Pharm 2017;8:162-172.
This is an open access article distributed under the terms of the Creative Commons Attribution-NonCommercial-ShareAlike 3.0 License, which allows others to remix, tweak, and build upon the work non-commercially, as long as the author is credited and the new creations are licensed under the identical terms.
Abstract
Context: High proportion of antibiotic resistance is increasing in bacteria. Aim: Designing and synthesizing novel sulphonamides as anti-bacterial. Settings and Design: Standard drug design process. Methods and Materials: ANNQSAR model, docking studies, applicability domain (Williams plot), distance mapping, HOMO, LUMO surface study, mapped density surface study, NMR (1H and C-13), IR, MASS, CHNS, Kirby-Bauer’s disk diffusion method were used. Statistical analysis used: Fraction of variance (r2), Cross-Validation Test (q2), Standard deviation (s), r2-q2 < 0.3, Quality Factor (Q), Fischer Statistics (F) and Y-Randomization Test were used as a part of this study. Results: Most active compound of the series was 4-[(3-Methoxy-phenylamino)-methyl]- benzenesulfonamide found against E. coli. Conclusions: Novel designed and synthesized sulfonamides act as potential anti-bacterials.
Keywords
Drug design, QSAR, docking, scaffold, sulfonamide, antibacterial
Introduction
Several sulfonamides have been studied and found to possess interesting biological activities such as anticonvulsant,[1-5] antitubercular [6,7] and antimicrobial.[8,9] Out of these activities, in the present study, antimicrobial activity has been considered. In all regions of the world, the high proportion of antibiotic resistance is increasing in bacteria that cause common infections as blood stream infections, pneumonia and urinary tract infections etc. About 9.0% of MDR-TB cases have found with extensive drug resistant. To overcome the problems of drug resistance for antimicrobial activity, there is substantial need to develop new potential leads. Sulfonamide derivatives have also found to be with a wide range for antimicrobial activity.[10] Now a day drug resistance against bacteria have emerges with public health problem all over the world. The case of penicillin resistance worldwide could be considered as one of the best example. Multi-drug resistance has created another problem to work with. This type of problem could be observed in continents like Europe, Asia and America with vancomycin resistance. [11-18] The above mentioned problems and others like these promoted us to contribute hands a little towards solving the problems.
Mode of action of sulfonamide drugs observed so far is inhibition of carbonic anhydrase against a wide range of bacteria. The substituted ring of benzenesulfonamide containing -SO2NH2 groups act by binding or coordination of the -SO2NH- anion to the Zn2+ of the enzyme, mimicking the bicarbonate anion in the transition state.[19] The mode of action of sulphonamide drugs is inhibition of metabolic processes. They interfere with folic acid synthesis by preventing addition of paraaminobenzoic acid into the folic acid molecule through competing for enzyme dihydropteroate synthetase, which catalyzes an enzyme in the biosynthesis of tetrahydrofolate and then nucleotides.[5]
In this study, we synthesized novel antibacterial compounds tested against E. coli and Bacillus subtilis. All the designed and synthesized compounds were initially screened via two tier screening system consisting of QSAR model and docking studies.
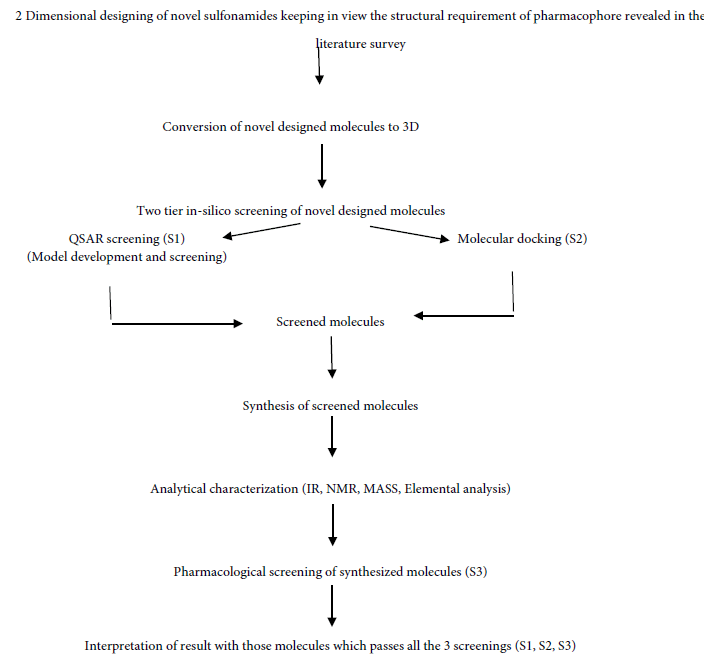
The following criteria has been designed and adopted in this research and development:
Subjects and Methods
Preparation of 2D structures of novel designed molecules
The 2D structure construction, energy minimization and geometry optimization of the designed sulfonamide derivatives were carried out by using ChemDraw Ultra 7.0 and Chem3D Pro 7.0 (CambridgeSoft Corporation, 100 CambridgePark Drive, Cambridge MA, 02140 USA) on an Intel(R) Core(TM)2 Duo Central Processing Unit T6670 @ 2.20 GHz and 4.00 GB of RAM, running the Windows 7 Home Basic, 64-bit compatible operating system. The energy minimization was carried out to minimum RMS Gradient of 0.100, with step interval of 2.0 Fs and frame interval of 10 Fs.
Model preparation
Bioactivity values and information about 2D structure of sulfonamide analogues were taken from literature. Log1/C is a variable that comprises the bioactivity parameter for the QSAR model. In order to calculate the molecular descriptors, PaDEL descriptor software, which incorporate CDK library for descriptor calculation has been used after optimizing the sulfonamide analogues. For the development of QSAR model, Artificial Neural Network (ANN) has been employed and all were validated through statistics.[20-28]
Descriptor selection
The selection of descriptors among the calculated descriptors for the Artificial Neural Network (ANN) is based on the correlation matrix. This matrix is analyzed for the least correlated descriptors.[20-28]
Statistical parameters
In the QSAR model, number of data points is denoted as n, squared correlation coefficient as r2 (fraction of variance), cross-validated r2 is denoted as q2. Other parameters includes are r2-q2<0.3, root mean square deviation (RMSD), variance and Fischer statistics is denoted by F.[20-28]
Model validation
The QSAR model validation was carried with statistical analysis and with internal validation.[20-28]
Artificial Neural Network (ANN)
To produce a complex system, simple elements may be gathered. [29] Networks are the concept for achieving this. There are too many different types of networks, but they all are characterized by some components: a set of nodes, and connections between nodes.
These are used to model a wide range of phenomena in physics, computer science, pharmacy, biochemistry, sociology, ethology, mathematics, economics, telecommunications, and many other areas. This is because many systems can be seen as a network such that chemical molecule, proteins, computers, communities, etc.
One type of network assumes the nodes as ‘artificial neurons’. These are known as artificial neural networks (ANNs). An artificial neuron is a computational model simulates the natural neurons. Natural neurons receive signals from synapses located on the dendrites or membrane of the neuron. When the signals received a minimum required amount, the neuron is activated and emits a signal through the axon and so on.
Applicability domain of model
Williams plot
Williams plot was used to judge the applicability domain of model. It has been defined by Leverage value and Standardized residual values.
Scaffold studies
These studies have been performed with the help of ArgusLab 4.0.1, in which we gone through distance mapping, molecular orbital surface and ESP-mapped density surface studies.
Docking studies
Docking
Molecular docking techniques are used in modern drug design to help understand drug–receptor interaction. It has been shown in the literature that these computational procedures can strongly support and help the design of new, more potent drugs by revealing the mechanism of drug–receptor interaction. Rational drug design helps to facilitate and speedup the drug designing process, which involves variety of methods to identify novel compound, out of them one method is the docking of the drug molecule with the receptor. The therapeutic action of the clinical drug will be effective when the biochemical pathway of the enzyme can be exploited.[20-28]
Docking procedures allows virtually screening a data-base of compounds and predict the strongest binder based on various scoring functions.[20-28]
Receptor
Bacillus subtilis lipase A, E. coli primosomal protein
Docking tool
Docking has been performed with AutoDock Vina (PyRx-Python Prescription 0.8) docking software. It is virtual screening software for computational drug discovery that can be used to screen libraries of compounds against potential drug targets. It enables medicinal chemists to run virtual screening form any platform and helps users in every steps of this process from data preparation to job submission and analysis of the results.[20-28]
For performing docking, all receptors have been downloaded from NCBI website with PDB ID 1R4Z (Bacillus subtilis lipase A), 2CCZ (E. coli primosomal protein), all the designed ligands have been docked with protein (receptor) with AutoDock Vina (PyRx-Python Prescription 0.8) software having its default settings.
Synthesis and spectral characterization
All the chemicals and solvents, purchased from Merck (India), Spectrochem (India), Sigma-Aldrich (India), Himedia (India) and S. D. Fine (India) were used without further purification. Thin layer chromatographic analysis of compounds was performed on silica gel G coated glass plates. The adsorbent silica gel G was coated to a thickness of about 0.3 mm on previously cleaned TLC plates of 20 × 5 cm using conventional spreader. The plates were placed in hot air oven at 105°C for 30 min. The solutions of compounds were applied as a spot on the activated plate about 2 cm above from the lower edge. The mobile phases were selected according to the polarity of compounds.
Melting points were determined by using open capillary melting point apparatus and are reported uncorrected. FT-IR spectra (KBr) were recorded on a Perkin-Elmer Spectrometer BX-II spectrophotometer. The 1H-NMR spectra were recorded on Bruker 400 MHz and C-13 NMR were recorded on 100 MHz High Resolution NMR spectrometer. Chemical shifts were reported in ppm (δ) and signals were described as singlet (s), doublet (d), triplet (t) and multiplet (m). The mass spectra were recorded on a Waters Micro-Mass ZQ 2000 mass spectrometer. A elemental analysis of compounds have also been performed on a vario EL III CHNS elemental analyzer for estimating percentage purity.
Synthesis of substituted 4-aminobenzenesulfonamides
For the synthesis of an appropriate amide, the (2-Chloro-substituted)- substituted benzene (0.009 mol) dissolved in 20 ml. of dry acetone was added dropwise to a stirred solution of aromatic aminosulfonamide (0.0092 mol) and pyridine (0.0091mol) in 50 ml. of dry acetone. After addition, the reaction mixture was stirred for about 12 hour at room temperature and then the solvent was evaporated under reduced pressure. The residue was dissolved in 100 ml. ethyl acetate and the organic phase washed three times with 20 ml. of distilled water. Then 10% HCl solution was added until pH 1 was reached, and the organic phase was separated from the aqueous phase and washed three times with brine. The aqueous solutions were combined and extracted with ethyl acetate. The ethyl acetate extracts were combined, dried over MgSO4, filtered and evaporated under reduced pressure. Further, the dried products have been purified by subjecting it with ethanol: petroleum ether (1:3) mixture to give white to off white pure crystalline powder.[5]
Antibacterial screening
Media
Mueller Hinton Media with the formula of Acid hydrolysate of casein 17.5 gm/lt., beef extract 2 gm/lt., starch 1.5 gm/lt. and agar 17.0 gm/lt. with pH of around 7.[30-34]
Kirby-Bauer’s disk diffusion method
Antibacterial screening of synthesized compounds has been performed by Kirby-Bauer’s disk diffusion method, which was also recommended by NCCLS (National Committee for Clinical Laboratory Standards). [30-34]
Results and Discussion
Artificial Neural Network (ANN) model
As earlier described that artificial neurons describes as input neurons/ nodes, here 3 input nodes are used which corresponds to descriptors used, which are Eccentric Connectivity index (ECI); Lipo-affinity Index (LAI) and AlogP. There are 3 hidden nodes are used along with one output node [Scheme 1]. Optimized value of learning rate is 0.05 as amounts the weights and momentum applied to the weights are 0.2. The 2D structure of sulphonamide derivatives from which the QSAR model have been developed is shown in Figure 1 and data given in Table 1, QSAR-ANN model was developed where number of data point (n) is 25 and number of descriptors used are 3.

Scheme 1: Synthetic scheme of substituted 4-aminomethyl-benzenesulfonamide from (2-Chloro-substituted)-substituted benzene.

Figure 1: Structures of sulphonamide derivatives for developing the QSAR model
| Training set | Observed log1/C | AlogP | ECI | LAI |
|---|---|---|---|---|
| 1 | 4.35 | 0.0623 | 325 | 5.0764 |
| 2 | 4.45 | -0.2073 | 260 | 4.0409 |
| 3 | 4.35 | 0.0431 | 294 | 4.4324 |
| 4 | 4.47 | -0.2073 | 304 | 3.9765 |
| 5 | 4.66 | 0.7377 | 262 | 4.2386 |
| 6 | 4.46 | 0.7377 | 243 | 4.2519 |
| 7 | 4.6 | 0.7377 | 245 | 4.2478 |
| 8 | 4.8 | 0.0431 | 321 | 4.4250 |
| 9 | 4.8 | -0.2073 | 279 | 4.0021 |
| 10 | 4.89 | 0.66 | 262 | 3.6797 |
| 11 | 4.89 | 0.744 | 262 | 3.6550 |
| 12 | 4.99 | 0.744 | 243 | 3.5094 |
| 13 | 4.95 | 0.5738 | 262 | 3.7559 |
| 14 | 5.6 | 0.5046 | 298 | 3.0092 |
| 15 | 6 | 0.5046 | 325 | 2.9494 |
| 16 | 4.32 | 1.1841 | 260 | 4.4875 |
| 17 | 4.8 | 1.1064 | 260 | 3.9342 |
| 18 | 4.8 | 1.1064 | 258 | 3.9074 |
| 19 | 5.4 | 1.0287 | 279 | 3.2765 |
| 20 | 5.55 | 1.0287 | 262 | 3.3275 |
| 21 | 5.1 | 0.1614 | 294 | 3.7230 |
| 22 | 5.55 | 0.951 | 340 | 3.2527 |
| 23 | 5.41 | 0.951 | 311 | 3.3990 |
| 24 | 5.64 | 0.9573 | 340 | 2.3351 |
| 25 | 5.32 | 1.4071 | 391 | 6.4116 |
Table 1: log1/C values and descriptors of sulphonamide derivatives used to derive QSARmodel.
Validation of QSAR model
A quantitative assessment of model robustness has been performed through model validation. All the statistical results of model validation have been given in Table 2.
| n/p(≥4) | r2 | q2 | r2-q2<0.3 | RMSD | Q | Variance | F | |
|---|---|---|---|---|---|---|---|---|
| ANN | 8.33 | 0.8567 | 0.5707 | 0.2719 | 0.1765 | 2.04 | 0.211 | 41.84 |
Table 2: Statistical results of model validation.
Statistical analysis
(1) n/p ratio: n/p= ≥ 4, where n is the number of data points and p is the number of descriptors used in the QSAR model. The model obeys the condition.
(2) Fraction of variance (r2): The value of fraction of variance may vary between 0 (means model without explanatory power) and 1 (means perfect model). QSAR model having r2>0.6 will only be considered for validation.
(3) Cross-Validation Test (q2): A QSAR model must have q2>0.5 for the predictive ability.
(4) Standard deviation (s): The smaller s value is always required for the predictive QSAR model.
(5) r2-q2<0.3: The difference between r2 and q2 should never be exceeding by 0.3. A large difference suggests the following: presence of outliers, over-fitted model, and presence of irrelevant variables in data.
(6) Quality Factor (Q): Over fitting and chance correlation, due to excess number of descriptors, can be detected by Q value. Positive value for this QSAR model suggests its high predictive power and lack of over fitting.
(7) Fischer Statistics (F): The F value of QSAR model was compared with their literature value at 95% level.
Internal validation
Y-Randomization Test: To establish the QSAR model robustness, this technique is being used widely. For this test, the dependent variable vector is randomly shuffled, and a new QSAR model is developed using the unchanged independent variable. This process was repeated for five times. The values r2<0.6 in Y-randomization test confirm the robustness of this QSAR model.[20] The statistical data of r2 for randomized five runs are given in Table 3. An ANN curve of observed values and predicted values of log1/C for sulphonamide derivatives is shown in Figure 2 and predicted values are given in Table 4.

Figure 2: A plot of observed values and predicted values of log1/C for sulphonamide derivatives (ANN)
| Training set | Shuffled observed log1/C | ||||
|---|---|---|---|---|---|
| Run 1 | Run 2 | Run 3 | Run 4 | Run 5 | |
| 1 | 6 | 6 | 4.35 | 6 | 4.35 |
| 2 | 4.45 | 4.45 | 4.45 | 4.45 | 4.45 |
| 3 | 4.35 | 5.55 | 5.55 | 5.55 | 5.32 |
| 4 | 4.47 | 4.47 | 4.47 | 4.47 | 4.47 |
| 5 | 4.66 | 4.66 | 4.66 | 4.66 | 4.66 |
| 6 | 4.46 | 4.46 | 4.46 | 4.46 | 4.46 |
| 7 | 4.6 | 4.6 | 4.6 | 4.6 | 4.6 |
| 8 | 4.8 | 4.8 | 4.8 | 4.8 | 4.8 |
| 9 | 4.8 | 4.8 | 4.8 | 4.89 | 4.8 |
| 10 | 4.89 | 4.89 | 4.89 | 4.8 | 4.89 |
| 11 | 4.89 | 4.89 | 4.89 | 4.89 | 4.89 |
| 12 | 4.99 | 4.99 | 4.99 | 4.99 | 4.99 |
| 13 | 4.95 | 4.95 | 4.95 | 4.95 | 4.95 |
| 14 | 5.6 | 5.6 | 5.6 | 5.6 | 5.6 |
| 15 | 4.35 | 4.35 | 4.35 | 4.35 | 4.35 |
| 16 | 4.32 | 4.32 | 4.32 | 4.32 | 4.32 |
| 17 | 4.8 | 4.8 | 4.8 | 4.8 | 4.8 |
| 18 | 4.8 | 4.8 | 4.8 | 4.8 | 4.8 |
| 19 | 5.4 | 5.4 | 5.4 | 5.4 | 5.4 |
| 20 | 5.55 | 5.55 | 5.55 | 5.55 | 5.55 |
| 21 | 5.1 | 5.1 | 5.1 | 5.1 | 5.1 |
| 22 | 5.55 | 4.35 | 6 | 4.35 | 6 |
| 23 | 5.41 | 5.41 | 5.41 | 5.41 | 5.41 |
| 24 | 5.64 | 5.64 | 5.64 | 5.64 | 5.64 |
| 25 | 5.32 | 5.32 | 5.32 | 5.32 | 5.55 |
| r2 | 0.3701 | 0.1942 | 0.4670 | 0.1902 | 0.4790 |
Table 3: Y-Randomization test results for ANN-QSAR model
| Compound ?S. No. |
Observed | log 1/C | |
|---|---|---|---|
| Predicted | Residuals | ||
| 1 | 4.35 | 4.498 | -0.148 |
| 2 | 4.45 | 4.349 | 0.101 |
| 3 | 4.35 | 4.519 | -0.169 |
| 4 | 4.47 | 4.753 | -0.283 |
| 5 | 4.66 | 4.429 | 0.231 |
| 6 | 4.46 | 4.447 | 0.013 |
| 7 | 4.6 | 4.447 | 0.153 |
| 8 | 4.8 | 4.81 | -0.01 |
| 9 | 4.8 | 4.492 | 0.308 |
| 10 | 4.89 | 4.907 | -0.017 |
| 11 | 4.89 | 4.969 | -0.079 |
| 12 | 4.99 | 4.831 | 0.159 |
| 13 | 4.95 | 4.812 | 0.138 |
| 14 | 5.6 | 5.546 | 0.054 |
| 15 | 6 | 5.681 | 0.319 |
| 16 | 4.32 | 4.663 | -0.343 |
| 17 | 4.8 | 4.967 | -0.167 |
| 18 | 4.8 | 4.96 | -0.16 |
| 19 | 5.4 | 5.475 | -0.075 |
| 20 | 5.55 | 5.309 | 0.241 |
| 21 | 5.1 | 4.993 | 0.107 |
| 22 | 5.55 | 5.707 | -0.157 |
| 23 | 5.41 | 5.6 | -0.19 |
| 24 | 5.64 | 5.776 | -0.136 |
| 25 | 5.32 | 5.134 | 0.186 |
Table 4: Predicted log1/C and there residuals obtained from non-linear model (ANN)
Applicability domain check for model Williams plot
Applicability domain (Figure 3) of model was defined by Leverage value (Hmax value=0.48 ANN model) and Standardized residual values (± 0.5572 for ANN model). All the data points exist in applicability domain for the model.

Figure 3: Williams plot for ANN model showing all the training set within the applicability domain.
Screening of novel designed compounds via QSAR model developed
All the designed and synthesized compounds have been filtered with the developed ANN QSAR model and their log1/C values have been predicted and is given in Table 5.
| Compound no. | Predicted log1/C | AlogP | ECI | LAI |
|---|---|---|---|---|
| 8 | 3.819 | -0.8244 | 370 | 3.8194 |
| 10 | 4.562 | -0.1263 | 418 | 4.5623 |
| 11 | 4.564 | -0.1263 | 391 | 4.5642 |
| 12 | 4.562 | -0.1263 | 366 | 4.5617 |
| 13 | 3.825 | -0.8244 | 347 | 3.8251 |
| 14 | 3.83 | -0.8244 | 345 | 3.8300 |
| 15 | 4.396 | -0.0772 | 414 | 4.3964 |
| 16 | 4.394 | -0.0772 | 387 | 4.3939 |
Table 5: Descriptors and predicted log1/C of novel designed compounds.
Scaffold study
This section has been comprises for studying essential structural requirements of designing sulphonamides as antibiotics. In this context, we studied distance mapping, molecular orbital surface and ESP-mapped density surface.
Distance mapping of scaffold designed
Distance mapping of both training set and test set have been calculated and listed in Tables 6 and 7. This distance map comprises of distance among hydrogen bond acceptors (HBA1 and HBA2) and hydrogen bond donors (HBD). The minimum, maximum range and average distance have been shown in Table 8. Distance map of scaffold designed has been shown in Figure 4.

Figure 4: Distance map of scaffold designed
| S. No. | HBA1-HBD (?) | HBA2-HBD (?) | HBA1-HBA2 (?) |
|---|---|---|---|
| 1 | 6.62803 | 6.56688 | 2.45652 |
| 2 | 6.57332 | 6.62425 | 2.45417 |
| 3 | 6.55496 | 6.63307 | 2.45086 |
| 4 | 6.62574 | 6.5521 | 2.45626 |
| 5 | 6.62027 | 6.55362 | 2.45674 |
| 6 | 6.55724 | 6.62817 | 2.45185 |
| 7 | 6.7114 | 6.72042 | 2.46729 |
| 8 | 6.54888 | 6.60897 | 2.45761 |
| 9 | 6.55025 | 6.60325 | 2.45682 |
| 10 | 6.62917 | 6.56248 | 2.45793 |
| 11 | 6.62529 | 6.56011 | 2.45806 |
| 12 | 6.54163 | 6.62678 | 2.4512 |
| 13 | 6.62562 | 6.5563 | 2.45827 |
| 14 | 6.62041 | 6.59774 | 2.4616 |
| 15 | 6.62723 | 6.5604 | 2.45734 |
| 16 | 6.54946 | 6.62836 | 2.45089 |
| 17 | 6.56331 | 6.63026 | 2.45284 |
| 18 | 6.48596 | 6.63669 | 2.45654 |
| 19 | 6.63247 | 6.56366 | 2.45875 |
| 20 | 6.63251 | 6.5686 | 2.45879 |
| 21 | 6.5732 | 6.62648 | 2.45519 |
| 22 | 6.54522 | 6.62858 | 2.45308 |
| 23 | 6.48356 | 6.67556 | 2.44276 |
| 24 | 6.53785 | 6.64127 | 2.45184 |
| 25 | 6.52012 | 6.65779 | 2.44983 |
Table 6: Distance map between HBA1-HBD, HBA2-HBD and HBA1-HBA2 for training set.
| S. No. | HBA1-HBD (Å) | HBA2-HBD (Å) | HBA1-HBA2 (Å) |
|---|---|---|---|
| 1 | 7.57607 | 7.44564 | 2.4551 |
| 2 | 7.43469 | 7.61495 | 2.45481 |
| 3 | 7.34103 | 7.50357 | 2.56242 |
| 4 | 7.2518 | 7.72762 | 2.45635 |
| 5 | 7.56757 | 7.44689 | 2.45505 |
| 6 | 7.44443 | 7.57644 | 2.45495 |
| 7 | 7.44651 | 7.57549 | 2.45527 |
| 8 | 7.3998 | 7.69448 | 2.45425 |
Table 7: Distance map between HBA1-HBD, HBA2-HBD and HBA1-HBA2 for test set.
| Training set (Å) | Test set (Å) | |||||
|---|---|---|---|---|---|---|
| Min. | Max. | Avg. | Min. | Max. | Avg. | |
| HBA1-HBD | 6.48356 | 6.7114 | 6.582524 | 7.2518 | 7.57607 | 7.4327375 |
| HBA2-HBD | 6.67556 | 6.72042 | 6.6084716 | 7.44564 | 7.72762 | 7.573135 |
| ?HBA1-HBA2 | 2.44276 | 2.46729 | 2.4553212 | 2.45425 | 2.56242 | 2.468525 |
Table 8: Comparing training set and test data for maximum, minimum and average distances between HBA1-HBD, HBA2-HBD and HBA1-HBA2.
Molecular orbital surface of scaffold designed
Molecular orbital surface containing both type i.e., HOMO (Highest Occupied Molecular Orbital) and LUMO (Lowest Unoccupied Molecular Orbital) have been shown in Figures 5 and 6.

Figure 5: HOMO (Highest Occupied Molecular Orbital) surface of scaffold designed.

Figure 6: LUMO (Lowest Unoccupied Molecular Orbital) surface of scaffold designed.
ESP-mapped density surface of scaffold designed
The electrostatic potential has been mapped in the form of density surface, shown in the Figure 7.

Figure 7: ESP-mapped density surface of scaffold designed
Prediction of ADME property and other essentials
A computational study for prediction of ADME properties of novel designed compounds was performed (Table 9). Topological polar surface area (TPSA), i.e., surface belonging to polar atoms, is a descriptor that was shown to correlate well with passive molecular transport through membranes and, therefore, allows prediction of transport properties of drugs in the intestines.[34]
| Compound no. | Lipinski Failures | TPSA | E-max | No. of rotating bonds |
|---|---|---|---|---|
| 8 | 0 | 106.59 | 11.2538 | 4 |
| 10 | 0 | 89.8 | 11.2823 | 5 |
| 11 | 0 | 89.8 | 11.2904 | 5 |
| 12 | 0 | 89.8 | 11.3008 | 5 |
| 13 | 0 | 106.59 | 11.2574 | 4 |
| 14 | 0 | 106.59 | 11.2619 | 4 |
| 15 | 0 | 97.64 | 11.3109 | 5 |
| 16 | 0 | 97.64 | 11.5168 | 5 |
Table 9: Calculated descriptive properties of novel synthesized compounds for drug likeness property. TPSA-Topological Polar Surface Area; E-max-Electrotopological state (Maximum)..
Docking
Docking study of different proteins were performed with the designed inhibitors is given in Table 10 and number of hydrogen bonds and binding pattern such as element, type of bond, atom number and residue at binding site were evaluated.
| Ligand (Comp. no.) | Recept. | Affinity Kcal/mol |
H- bonds |
H- Binding Ligand | H- Binding Receptor | |||||
|---|---|---|---|---|---|---|---|---|---|---|
| Elem. | At. ID. | Type | Res.? | Elem. | At.ID. | Type | ||||
| 8 | 1R4Z | -6.2 | 4 | N | 15 | Donor | Tyr 37 | O | 270 | Both |
| N | 21 | Donor | Leu 36 | O | 254 | Acceptor | ||||
| O | 19 | Acceptor | Lys 23 | N | 150 | Donor | ||||
| O | 19 | Acceptor | Ala 38 | N | 271 | Donor | ||||
| 2CCZ | -6.8 | 6 | 15 | N | Donor | Ala94 | O | 729 | Acceptor | |
| 15 | N | Donor | Ser55 | O | 443 | Acceptor | ||||
| 15 | N | Donor | Asn59 | O | 475 | Acceptor | ||||
| 7 | N | Donor | Glu38 | O | 325 | Acceptor | ||||
| 20 | O | Acceptor | Gln37 | N | 317 | Donor | ||||
| 20 | O | Acceptor | Arg4 | N | 55 | Donor | ||||
| 10 | 1R4Z | -6 | 4 | N | 15 | Acceptor | Tyr 37 | O | 270 | Both |
| O | 19 | Acceptor | Lys 23 | N | 150 | Donor | ||||
| O | 19 | Acceptor | Ala 38 | N | 271 | Donor | ||||
| O | 18 | Acceptor | Arg 33 | N | 232 | Donor | ||||
| 2CCZ | -6.6 | 5 | O | 15 | Acceptor | Lys 82 | N | 646 | Donor | |
| N | 20 | Donor | Ser 88 | O | 681 | Acceptor | ||||
| N | 20 | Donor | Ser 88 | O | 683 | Both | ||||
| O | 19 | Acceptor | Lys 82 | N | 654 | Donor | ||||
| O | 18 | Acceptor | Met 90 | N | 704 | Donor | ||||
| 11 | 1R4Z | -6.4 | 4 | O | 18 | Acceptor | Lys 23 | N | 150 | Donor |
| O | 18 | Acceptor | Ala 38 | N | 271 | Donor | ||||
| N | 20 | Donor | Leu 36 | O | 254 | Acceptor | ||||
| O | 15 | Acceptor | Tyr 37 | O | 270 | Both | ||||
| 2CCZ | -7 | 3 | N | 07 | Donor | Ser 55 | O | 456 | Acceptor | |
| O | 18 | Acceptor | Glu 58 | N | 473 | Donor | ||||
| O | 15 | Acceptor | His 93 | N | 730 | Donor | ||||
| 12 | 1R4Z | -6.1 | 3 | O | 18 | Acceptor | Ala 38 | N | 271 | Donor |
| O | 18 | Acceptor | Lys 23 | N | 150 | Donor | ||||
| N | 20 | Donor | Leu 36 | O | 254 | Acceptor | ||||
| 2CCZ | -6.1 | 2 | N | 20 | Donor | Leu 16 | O | 149 | Acceptor | |
| O | 15 | Acceptor | Arg 44 | N | 359 | Donor | ||||
| 13 | 1R4Z | -6.3 | 4 | O | 19 | Acceptor | Ala 38 | N | 271 | Donor |
| O | 19 | Acceptor | Lys 23 | N | 150 | Donor | ||||
| N | 21 | Donor | Leu 36 | O | 254 | Acceptor | ||||
| N | 15 | Donor | Tyr 37 | O | 270 | Both | ||||
| 2CCZ | -6.5 | 5 | N | 15 | Donor | Asn 59 | O | 475 | Acceptor | |
| N | 15 | Donor | Glu 58 | O | 468 | Acceptor | ||||
| O | 20 | Acceptor | Gln 37 | N | 317 | Donor | ||||
| O | 20 | Acceptor | Arg 4 | N | 55 | Donor | ||||
| N | 07 | Donor | Glu 38 | O | 325 | Acceptor | ||||
| 14 | 1R4Z | -6.2 | 3 | O | 19 | Acceptor | Ala 38 | N | 271 | Donor |
| O | 19 | Acceptor | Lys 23 | N | 150 | Donor | ||||
| N | 21 | Donor | Leu 36 | O | 254 | Acceptor | ||||
| 2CCZ | -6.3 | 6 | O | 20 | Acceptor | Arg 44 | N | 358 | Donor | |
| O | 20 | Acceptor | Arg 44 | N | 359 | Donor | ||||
| N | 21 | Donor | Ser 79 | O | 634 | Both | ||||
| N | 21 | Donor | His 93 | N | 733 | Acceptor | ||||
| N | 07 | Donor | Lys 89 | O | 698 | Acceptor | ||||
| N | 15 | Donor | Met 90 | O | 707 | Acceptor | ||||
| 15 | 1R4Z | -6.8 | 4 | O | 19 | Acceptor | Ala 38 | N | 271 | Donor |
| O | 19 | Acceptor | Lys 23 | N | 150 | Donor | ||||
| N | 21 | Donor | Leu 36 | O | 254 | Acceptor | ||||
| O | 17 | Acceptor | Tyr 37 | O | 270 | Both | ||||
| 2CCZ | -6.9 | 5 | O | 20 | Acceptor | Arg 44 | N | 358 | Donor | |
| O | 20 | Acceptor | Arg 44 | N | 359 | Donor | ||||
| N | 21 | Donor | Ser 79 | O | 634 | Both | ||||
| N | 21 | Donor | His 93 | N | 733 | Acceptor | ||||
| N | 07 | Donor | Lys 89 | O | 698 | Acceptor | ||||
| 16 | 1R4Z | -6.2 | 4 | N | 21 | Donor | Asp72 | O | 546 | Acceptor |
| N | 21 | Donor | Leu173 | O | 1293 | Acceptor | ||||
| O | 19 | Acceptor | Asn 98 | N | 736 | Donor | ||||
| O | 16 | Acceptor | Asn 4 | N | 10 | Donor | ||||
| 2CCZ | -6.6 | 4 | N | 21 | Donor | Ser 88 | O | 681 | Acceptor | |
| N | 21 | Donor | Ser 88 | O | 683 | Both | ||||
| O | 20 | Acceptor | Lys 82 | N | 654 | Donor | ||||
| O | 19 | Acceptor | Met 90 | N | 704 | Donor | ||||
Table 10: Docking analysis of synthesized compound.
On docking analysis, designed compound 8 has been found to be strongly docked with 2CCZ as compared to 1R4Z, with 6 hydrogen bonds and binding affinity of -6.2 Kcal/mol. On residue study Ala94, Ser55, Asn59, Glu38, Gln37 and Arg4 were found to be significant. On the account of ligand nitrogen atom is significant in binding with donor bonds, whereas significant element in receptor is oxygen.
On docking analysis, designed compound 10 has been found to be strongly docked with 2CCZ as compared to 1R4Z, with 5 hydrogen bonds and binding affinity of -6.6 Kcal/mol. On residue study Lys88 and Ser88 were found to be significant. On the account of ligand oxygen atom is significant in binding with acceptor bonds, whereas significant element in receptor is nitrogen.
On docking analysis, designed compound 11 has been found to be strongly docked with 2CCZ as compared to 1R4Z, with 3 hydrogen bonds and binding affinity of -7 Kcal/mol. On residue study Ser55, Glu58 and His93 were found to be significant. On the account of ligand oxygen atom is significant in binding with donor bonds, whereas significant element in receptor is nitrogen.
On docking analysis, designed compound 12 has been found to be strongly docked with 1R4Z as compared to 2CCZ, with 3 hydrogen bonds and binding affinity of -6.1 Kcal/mol. On residue study Ala38, Lys23 and Leu36 were found to be significant. On the account of ligand nitrogen atom is significant in binding with donor bonds, whereas significant element in receptor is oxygen.
On docking analysis, designed compound 13 has been found to be strongly docked with 2CCZ as compared to 1R4Z, with 5 hydrogen bonds and binding affinity of -6.5 Kcal/mol. On residue study Asn59, Gln37, Glu38, Glu58 and Arg4 were found to be significant. On the account of ligand nitrogen atom is significant in binding with donor bonds, whereas significant element in receptor is oxygen.
On docking analysis, designed compound 14 has been found to be strongly docked with 2CCZ as compared to 1R4Z, with 6 hydrogen bonds and binding affinity of -6.3 Kcal/mol. On residue study Ser79, His93, Lys89, Met90 and Arg44 were found to be significant. On the account of ligand nitrogen atom is significant in binding with donor bonds, whereas significant element in receptor is oxygen.
On docking analysis, designed compound 15 has been found to be strongly docked with 2CCZ as compared to 1R4Z, with 5 hydrogen bonds and binding affinity of -6.9 Kcal/mol. On residue study Ser79, His93, Lys89 and Arg44 were found to be significant. On the account of ligand nitrogen atom is significant in binding with donor bonds, whereas significant element in receptor is oxygen.
On docking analysis, designed compound 16 has been found to be strongly docked with 2CCZ as compared to 1R4Z, with 4 hydrogen bonds and binding affinity of -6.6 Kcal/mol. On residue study Ala94, Ser55, Asn59, Glu38, Gln37 and Arg4 were found to be significant. On the account of ligand nitrogen atom is significant in binding with donor bonds, whereas significant element in receptor is oxygen. Figure 8 shows the docking images of all novel compounds with proteins 1R4Z and 2CCZ.

Figure 8: Docked images of designed molecules 8, 10, 11, 12, 13, 14, 15 and 16 with 1R4Z and 2CCZ
Compound characterization
After synthesizing the designed compounds, they were treated for physical data like percentage yield, retention factor (Rf), melting point and elemental data (CHNS analysis). The physical and elemental data of the compounds are reported in Table 11.
| Comp. | Molecular formula (MW) | Yield (%) | MP (0C) | Elemental analysis (%):Found (Calculated) | % purity | Rf | |||
|---|---|---|---|---|---|---|---|---|---|
| C | H | N | S | ||||||
| 8 | C13H15N3O2S (277.34) | 88.42 | 215-216 | 56.01 (56.30) | 4.98 (5.45) | 14.05 (15.15) | 11.14 (11.56) | 97.42 | 0.40 |
| 10 | C14H16N2O3S(292.35) | 68.22 | 209-210 | 56.81 (57.52) | 4.99 (5.52) | 9.42 (9.58) | 10.00 (10.97) | 97.16 | 0.42 |
| 11 | C14H16N2O3S (292.35) | 67.80 | 184-185 | 57.05 (57.52) | 5.10 (5.52) | 9.50 (9.58) | 10.88 (10.97) | 98.72 | 0.43 |
| 12 | C14H16N2O3S (292.35) | 62.00 | 180-181 | 57.10 (57.52) | 5.04 (5.52) | 9.48 (9.58) | 10.02 (10.97) | 97.88 | 0.49 |
| 13 | C13H15N3O2S (277.34) | 85.88 | 190-191 | 56.09 (56.30) | 4.93 (5.45) | 14.87 (15.15) | 11.01 (11.56) | 98.23 | 0.48 |
| 14 | C13H15N3O2S (277.34) | 80.02 | 185-186 | 56.02 (56.30) | 4.92 (5.45) | 15.01 (15.15) | 11.32 (11.56) | 98.65 | 0.52 |
| 15 | C15H16N2O3S (304.36) | 82.44 | 194-195 | 58.09 (59.19) | 5.10 (5.30) | 9.17 (9.20) | 9.28 (10.54) | 96.92 | 0.45 |
| 16 | C15H16N2O3S (304.36) | 78.80 | 190-191 | 58.97 (59.19) | 5.02 (5.30) | 9.01 (9.20) | 9.99 (10.54) | 98.52 | 0.57 |
Table 11:Physical and elemental data of all the synthesized compounds.
Spectral characterization of synthesized substituted 4-aminomethylbenzenesulfonamide
Compound number 8: 4-[(4-Amino-phenylamino)-methyl]-benzenesulfonamide
1H NMR (CDCl3, 400 MHz, δ in ppm): 4.43(s, 1H of -NH2 of C16); 4.83(d, 2H of C11); 5.64(s, Ar-H of C18); 5.74(s, Ar-H of C17); 6.34(s, Ar-H of C14); 6.46(s, Ar-H of C15); 6.84(s, Ar-H of C1); 6.88(s, Ar-H of C3); 6.97(d, Ar-H of C6); 7.24(s, Ar-H of C4); 7.47(m, 2H of -SO2NH2); 7.86(m, 1H of -NH2 of C16); 7.86(m, 1H of >NH). C13 NMR (CDCl3, 100 MHz, δ in ppm): 45.98(s, C11); 115.94(m, C14, C18); 117.81(m, C15, C17); 125.77(m, C1, C3); 125.86(m, C4, C6); 139.47(s, C16); 139.75(s, C13); 143.22(d, C5); 143.64(d, C2). IR (KBr, cm-1, ʋ): 1169.96, 758.31. MS (m/z, %): (277.08, M+, 95).
Compound number 10: 4-[(4-Methoxy-phenylamino)-methyl]- benzenesulfonamide
1H NMR (CDCl3, 400 MHz, δ in ppm): 3.81(m, 3H of -OCH3); 4.29(s, 1H of C11); 4.49(s, 1H of C11); 6.53(m, Ar-H of C14 and Ar-H of C18); 6.76(m, Ar-H of C15 and Ar-H of C17); 6.84(d, Ar-H of C3); 7.20(d, Ar-H of C4); 7.24(d, Ar-H of C6); 7.47(m, 2H of -SO2NH2); 7.59(s, Ar-H of C1); 7.85(s, 1H of >NH). C13 NMR (CDCl3, 100 MHz, δ in ppm): 45.98(s, C11); 56.04(s, C of –OCH3); 113.58(m, C14, C18); 115.51(m, C15, C17); 125.77(m, C1, C3); 125.86(m, C4, C6); 141.13(s, C13); 143.22(d, C5); 143.34(d, C2); 151.54(s, C16). IR (KBr, cm-1, ʋ): 1044.18, 904.95. MS (m/z, %): (292.08, M+, 75)
Compound number 11: 4-[(3-Methoxy-phenylamino)-methyl]- benzenesulfonamide
1H NMR (CDCl3, 400 MHz, δ in ppm): 3.82(m, 3H of -OCH3); 4.37(s, 1H of C11); 4.49(s, 1H of C11); 6.20(s, Ar-H of C18); 6.23(d, Ar-H of C14); 6.29(d, Ar-H of C16); 6.84(s, Ar-H of C3); 7.11(s, Ar-H of C15); 7.20(d, Ar-H of C4); 7.24(d, Ar-H of C6); 7.47(m, 2H of -SO2NH2); 7.59(s, Ar-H of C1); 7.85(s, 1H of >NH). C13 NMR (CDCl3, 100 MHz, δ in ppm): 46.86(s, C11); 56.04(s, C of -OCH3); 100.19(s, C18); 103.25(s, C16); 106.66(s, C14); 125.73(m, C1, C3); 125.83(m, C4 and C6); 129.63(s, C15); 143.04(s, C5); 143.43(s, C2); 148.73(s, C13); 160.92(s, C17). IR (KBr, cm-1, ʋ): 1300.52, 900.36. MS (m/z, %): (292.08, M+, 100).
Compound number12: 4-[(2-Methoxy-phenylamino)-methyl]- benzenesulfonamide
1H NMR (CDCl3, 400 MHz, δ in ppm): 3.80(m, 3H of -OCH3); 4.47(d, 1H of C11); 4.49(d, 1H of C11); 6.52(s, Ar-H of C14); 6.61(d, Ar-H of C16); 6.73(d, Ar-H of C17); 6.78(s, Ar-H of C15); 6.83(s, Ar-H of C3); 7.19(s, Ar-H of C4); 7.24(s, Ar-H of C6); 7.58(t, Ar-H of C1); 7.58(t, 2H of -NH2); 7.83(s, 1H of >NH). C13 NMR (CDCl3, 100 MHz, δ in ppm): 45.86(s, C11); 56.79(s, C of -OCH3); 112.12(s, C17); 114.22(s, C14); 118.75(s, C16); 121.18(s, C15); 125.77(m, C1 and C3); 125.86(m, C4 and C6); 138.77(s, C13); 143.22(d, C5); 143.34(d, C2); 146.25(s, C18). IR (KBr, cm-1, ʋ): 1090.58, 835.34. MS (m/z, %): (292.08, M+, 95).
Compound number13: 4-[(3-Amino-phenylamino)-methyl]- benzenesulfonamide
1H NMR (CDCl3, 400 MHz, δ in ppm): 4.43(s, 1H of -NH2 of C17); 4.79(s, 1H of C11); 4.94(s, 1H of C11); 5.42(s, Ar-H of C18); 5.51(s, Ar-H of C16); 5.99(s, Ar-H of C14); 6.67(s, Ar-H of C15); 6.84(d, Ar-H of C1); 6.88(d, Ar-H of C3); 7.11(s, Ar-H of C6); 7.24(s, Ar-H of C4); 7.47(m, 2H of -SO2NH2); 7.86(m, 1H of –NH2 of C17); 7.86(m, 1H of >NH). C13 NMR (CDCl3, 100 MHz, δ in ppm): 45.98(s, C11); 98.41(s, C18); 104.07(s, C14); 107.48(s, C16); 125.77(m, C1 and C3); 125.86(m, C4 and C6); 130.99(s, C15); 143.22(d, C5); 143.34(d, C2); 149.19(d, C13); 149.37(d, C17). IR (KBr, cm-1, ʋ): 1054.94, 901.09. MS (m/z, %): (277.08, M+, 95).
Compound number 14: 4-[(2-Amino-phenylamino)-methyl]- benzenesulfonamide
1H NMR (CDCl3, 400 MHz, δ in ppm): 4.43(s, 1H of –NH2 of C18); 4.84, 4.85(d, 2H of C11); 5.81(d, Ar-H of C17); 5.82(d, Ar-H of C16); 6.35(s, Ar-H of C14); 6.52(s, Ar-H of C15); 6.84(d, Ar-H of C1); 6.88(d, Ar-H of C3); 7.09(s, Ar-H of C6); 7.24(s, Ar-H of C4); 7.47(m, 2H of – SO2NH2); 7.86(m, 1H of –NH2 of C18); 7.86(m, 1H of >NH). C13 NMR (CDCl3, 100 MHz, δ in ppm): 45.86(s, C11); 115.90(s, C17); 116.46(s, C14); 119.03(s, C15); 120.34(s, C16); 125.77(m, C1 and C3); 125.86(m, C4 and C6); 134.46(s, C13); 137.67(s, C18); 143.22(d, C5); 143.34(d, C2). IR (KBr, cm-1, ʋ): 1629.81. MS (m/z, %): (277.08, M+, 95).
Compound number 15: 4-[(3-Acetyl-phenylamino)-methyl]- benzenesulfonamide
1H NMR (CDCl3, 400 MHz, δ in ppm): 2.54(m, 3H of C20); 4.38, 4.48(s, 2H of C11); 6.74(s, Ar-H of C14); 6.84(s, Ar-H of C3); 7.11(s, Ar-H of C18); 7.18(d, Ar-H of C16); 7.20(d, Ar-H of C4); 7.24(d, Ar-H of C6); 7.26(d, Ar-H of C15); 7.47(m, 2H of –SO2NH2); 7.59(s, Ar-H of C1); 7.86(s, 1H of >NH). C13 NMR (CDCl3, 100 MHz, δ in ppm): 27.79(s, C20 of –COCH3); 45.98(s, C11); 114.57(s, C18); 120.10(s, C14); 121.04(s, C16); 125.77(m, C1 and C3); 125.86(m, C4 and C6); 128.74(s, C15); 138.25(s, C17); 143.22(d, C5); 143.34(d, C2); 148.34(s, C13); 197.18(s, C19 of –COCH3). IR (KBr, cm-1, ʋ): 782.58. MS (m/z, %): (304.08, M+, 75).
Compound number 16: 4-[(2-Acetyl-phenylamino)-methyl]- benzenesulfonamide
1H NMR (CDCl3, 400 MHz, δ in ppm): 2.54(m, 3H of C21); 4.49, 5.17(s, 2H of C11); 6.68(s, Ar-H of C14); 6.78(s, Ar-H of C16); 6.83(s, Ar-H of C3); 7.19(s, Ar-H of C4); 7.24(d, Ar-H of C6); 7.29(d, Ar-H of C15); 7.59(s, Ar-H of C1); 7.65(t, 1H of C17); 7.66(m, 2H of –SO2NH2); 7.84(s, 1H of >NH). C13 NMR (CDCl3, 100 MHz, δ in ppm): 28.28(s, C21 of – COCH3); 45.86(s, C11); 114.69(s, C14); 116.76(s, C16); 124.57(s, C18); 125.77(m, C1 and C3); 125.86(m, C4 and C6); 130.21(s, C17); 132.66(s, C15); 143.22(d, C5); 143.34(d, C2); 147.67(s, C13); 201.78(s, C19 of – COCH3). IR (KBr, cm-1, ʋ): 1174.85, 775.40. MS (m/z, %): (304.08, M+, 67).
Pharmacological Evaluation- Antibac?terial Screening
Synthesized compounds were tested against Bacillus subtilis (ATCC 6633), E. coli (ATCC 25922). The concentration of novel synthesized compounds and standard drug sulfafurazole was 250 mcg/disc. One of the synthesized compounds (compound number 11) is found potent against E. coli and compound number 15 was found potent against Bacillus subtilis. Against E. coli few of compounds named compound number 8, 10, 13, 14 and 15 were found with moderate anti-bacterial activity [Table 12].
| Inhibition zone (mm) | ||
|---|---|---|
| Compound | Gram negative- E. coli | Gram positive- Bacillus subtilis |
| 8 (250 mcg) | 21 | 15 |
| 10 (250 mcg) | 21 | 14 |
| 11 (250 mcg) | 23 | 16 |
| 12 (250 mcg) | 19 | 15 |
| 13 (250 mcg) | 21 | 16 |
| 14 (250 mcg) | 21 | 16 |
| 15 (250 mcg) | 21 | 18 |
| 16 (250 mcg) | 20 | 15 |
| Sulfafurazole (250 mcg) | 21 | 18 |
Table 12: Antibacterial activity of novel synthesized compounds.
Conclusion
A series of substituted 4-aminomethyl-benzenesulfonamide were designed and synthesized and evaluated for anti-bacterial activity. A proper drug development process has been followed such as 2 Dimensional designing of novel sulfonamides keeping in view the structural requirement, conversion of novel designed molecules to 3D, Two tier in-silico screening of novel designed molecules (QSAR screening and Molecular docking) and synthesis of screened molecules. Compound number 11 was found significant against E. coli which emerged as a lead in the series and compound number 15 was found significant against Bacillus subtilis. Further, compound number 8, 10, 13 and 14 came out as a potential candidate for further investigation. Furthermore, no compound violated the Lipinski’s rule, making them potentially promising agents as anti-bacterial. However, further studies need to be carried out to ascertain the precise mechanism of action of anti-bacterial activity of these compounds.
References
- Masereel B. Carbonic Anhydrase Inhibitors: Anticonvulsant Sulfonamides Incorporating Valproyl and Other Lipophilic Moieties. J Med Chem 2002;45:312-20.
- Thiary A. Anticonvulsant Sulfonamides/Sulfamates/Sulfamides with Carbonic Anhydrase Inhibitory Activity: Drug Design and Mechanism of Action. Curr Pharm Des 2008;14:661-71.
- Siddiqui N. Sulfonamide Derivatives of Thiazolidin-4-ones with Anticonvulsant Activity Against Two Seizure Models: Synthesis and Pharmacological Evaluation. JEnzyme Inhib Med Chem 2010;25:485-91.
- Naama H, et al. Anticonvulsant 4-Aminobenzenesulfonamide Derivatives with Branched-Alkylamide Moieties: X-Ray Crystallography and Inhibition Studies of Human Carbonic Anhydrase Isoforms I, II, VII, and XIV. J Med Chem 2011;54:3977-81.
- Naama H. Syntheses and Evaluation of Anticonvulsant Profile and Teratogenicity of Novel Amide derivatives of Branched Aliphatic Carboxylic Acids with 4-Aminobenzensulfonamide. J Med Chem 2010;53:4177-86.
- Price T. Antitubercular Studies. V. 4-Aminobenzamides and 4-Aminobenzenesulfonamides.J Am ChemSoc1952;74:5961-63.
- Vannada J. Design, Synthesis, and Biological Evaluation of Beta-Ketosulfonamide Adenylation Inhibitors as Potential Antitubercular Agents. Org Lett 2006;8:4707-10.
- Perrin HL. Para-Aminobenzenesulfonamide and its Derivatives Experimental and Clinical Observations on Their Use in The Treatment of Betahemolytic Streptococcic Infection: A Preliminary Report. J Am Med Soc 1937;108:32-7.
- Heidi MB. Cross-Coupling of Sulfonamide Antimicrobial agents with Model Humic Constituents.Environ Sci Technol2005;39:4463-73.
- Naidu KM. Novel amide and sulphonamide derivatives of 6-(piperazin-1-yl)phenanthridine as potent Mycobacterium tuberculosis H37Rv inhibitors. Eur J Med Chem 2015;92:415-26.
- Jones ME, Blosser-Middleton RS, Thornsberry C, Karlowsky JA, Sahm DF. The Activity of Levofloxacin and other Antimicrobials Against Clinical Isolates of Streptococcus Pneumoniae Collected Worldwide During 1999-2002. DiagnMicrobiol Infect Dis. 2003;47:579-86.
- Fouda SI, Kadry AA, Shibl AM. Beta-Lactam andMacrolideResistanceandSerotype Distributionamong StreptococcusPneumoniaeIsolatesfromSaudiArabia. J Chemother 2004;16:517-23.
- Jenkins SG, Farrell DJ, Patel M, Lavin BS. TrendsinAnti-BacterialResistanceAmong StreptococcusPneumoniaIsolatedintheUSA,2000-2003:PROTEKUSyears1-3. J Infect 2005;51:355-63.
- Kaye KS, Engemann JJ, Fraimow HS, Abrutyn E. Pathogens Resistant to Antimicrobial Agents:Epidemiology, Molecular Mechanisms, and Clinical Management. Infect DisClin North Am 2004;18:467-11.
- Cuellar-Rodríguez J. Vancomycin-resistant enterococci, México City. Emerg Infect Dis 2007;13:798-9.
- Tenover FC. Mechanisms of Antimicrobial Resistance in Bacteria. Amer J Med 2006;119:3-10.
- Murthy A, De Angelis G, Pittet D, Schrenzel J, Uckay I. Cost-effectiveness of Universal MRSA Screening on Admission to Surgery. ClinMicrobiol Infect 2010;16:1747-53.
- Hong YL, Hossler PA, Calhoun DH, Meshnick SR. Inhibition of Recombinant Pneumocystis carinii dihydropteroate synthetase by Sulfa drugs. Antimicrob Agents Chemother 1995;39:1756-63.
- Furniss BS, Hannaford AJ, Smith PWG, Tatchell AR: Vogel’s Textbook of Practical Organic Chemistry; 1989.
- Verma RP, Hansch C. QSAR Modeling of Taxane Analogues against Colon Cancer. Eur J Med Chem 2010;45:1470-7.
- Ajeet A. QSAR Modeling of Recombinant Human Stromelysin Inhibitors- MLR approach. Int J Adv Pharm Biol Sci 2012;2:171-5.
- Ajeet A.Prediction of novel arylpiperazinyls (pyrrolidin-2-one derivatives) as Antiarrhythmic agents -QSAR model development. Int Jour of Pharm Arch 2012;1:12-20.
- Ajeet A. Prediction of 44 novel Succinyl Hydroxamates and their Carboxylic analogues against MMP2– QSAR modeling. Novel Science Int J Pharm Sci 2012;1:713-17.
- Ajeet A. Development of QSAR model for studying Sulfonamide derivatives against Carbonic anhydrase using Multiple Linear Regression with McGowan volume and AlogP as molecular descriptors. Jour Harmo Res Pharm 2013;2:45-53.
- Ajeet A. QSAR modeling of Beta-lactam antibiotic Cephalosporin against Transpeptidase using MLR method. Eur J Bioinform 2013;1:1-7.
- Ajeet A, Kumar P, Tripathi L. QSAR Model Development for Studying Sulfonamide Derivatives as Carbonic Anhydrase Inhibitors- A MLR Approach. Int J Pharm Res Tech 2013;5:74-81.
- Ajeet A. QSAR Study of Methionine Aminopeptidase Inhibitors as Anti-cancer Agents Using MLR Approach. Am J Pharmacolog Sci 2013;1:80-83.
- Ajeet A. Triterpene acid (3β-hydroxyurs-12-en-28-oic acid) against Human Lung Cancer A-549 cells- Multiple Linear Regression based QSAR modeling. Eur J Bioinform 2013;1:8-14.
- Bar-Yam Y. Dynamics of Complex Systems. Addison-Wesley: Boston;1997
- James JB. Antimicrobial Susceptibility Testing by the Kirby-Bauer Disc Diffusion Method. Annals. Clin Lab Sci 1973;3:135-40.
- Jones ME, Blosser-Middleton RS, Thornsberry C, Karlowsky JA, Sahm DF. The activity of Levofloxacin and other Antimicrobials against Clinical isolates of Streptococcus pneumoniae collected worldwide during 1999-2002. Diagn. Microbiol. Infect. Dis. 2003;47:579-86.
- Kaye KS, Engemann JJ, Fraimow HS, Abrutyn E. Pathogens resistant to Antimicrobial agents: Epidemiology, Molecular mechanisms and Clinical Management. Infect Dis Clin North Am 2004;18:467-511.
- Tenover FC. Mechanisms of antimicrobial resistance in bacteria. Amer J Med 2006;119:3-10.
- Ertl P, Rohde B, Selzer P. Fast Calculation of Molecular Polar Surface Area as a Sum of Fragment-Based Contributions and Its Application to the Prediction of Drug Transport Properties. J Med Chem 2000;43:3714-17.